Options Liquidity: Why It Matters More Than Beginners Think

📚 Beginner’s Guide to Options — Part 44 of 51
- Part 1: What Is an Option? The Absolute Basics Explained
- Part 2: Calls vs. Puts: The Two Types of Options You Need to Know
- Part 3: Strike Price Explained: What It Actually Means for Your Trade
- Part 4: Expiration Date Explained: Why It Changes Everything
- Part 5: Premium Explained: What You’re Really Paying For
- Part 6: In the Money vs. Out of the Money: A Beginner’s Breakdown
- Part 7: Intrinsic Value vs. Extrinsic Value: What Makes Up an Option’s Price
- Part 8: How Buying a Call Option Works, Step by Step
- Part 9: How Buying a Put Option Works, Step by Step
- Part 10: What Happens When an Option Expires? Every Outcome Explained
- Part 11: Options Contracts 101: What One Contract Actually Represents
- Part 12: How to Read an Options Chain Without Getting Overwhelmed
- Part 13: Bid, Ask, and Spread: What They Mean When You’re Trading Options
- Part 14: What Is Implied Volatility? A Beginner’s Plain-English Guide
- Part 15: Why Options Lose Value Over Time: Theta Explained Simply
- Part 16: Delta Explained: What It Really Tells You About Your Option
- Part 17: Gamma Explained: Why Delta Doesn’t Stay the Same
- Part 18: Vega Explained: How Volatility Changes Your Option’s Price
- Part 19: The Greeks Cheat Sheet: Delta, Gamma, Theta, Vega in Plain English
- Part 20: What Is Assignment? What Happens If Your Option Gets Exercised
- Part 21: American vs. European Options: What’s the Difference?
- Part 22: How Much Money Do You Need to Start Trading Options?
- Part 23: Paper Trading Options: How to Practice Before Risking Real Money
- Part 24: The Biggest Mistake Beginners Make Buying Options
- Part 25: Why Most Beginners Lose Money Buying Options (and How to Avoid It)
- Part 26: Covered Calls Explained: The First Options Strategy Every Trader Should Learn
- Part 27: Cash-Secured Puts Explained: A Beginner-Friendly Way to Get Paid to Wait
- Part 28: Vertical Spreads Explained: Reducing Risk on Your First Options Trade
- Part 29: Credit Spreads vs. Debit Spreads: What’s the Real Difference?
- Part 30: The Protective Put Explained: Insurance for Your Stock Position
- Part 31: The Collar Strategy Explained: Protecting Gains Without Selling
- Part 32: Straddles Explained: Betting on a Big Move (In Either Direction)
- Part 33: Strangles Explained: A Cheaper Way to Bet on a Big Move
- Part 34: The Iron Condor Explained for Complete Beginners
- Part 35: The Wheel Strategy Explained: Getting Paid on Stocks You Want to Own
- Part 36: How Earnings Season Changes Options Pricing (and What to Watch For)
- Part 37: Why Options Get More Expensive Before Earnings: IV Crush Explained
- Part 38: Choosing the Right Strike Price for Your First Options Trade
- Part 39: Choosing the Right Expiration Date: Weekly vs. Monthly Options
- Part 40: How to Size an Options Position So One Bad Trade Doesn’t Wreck You
- Part 41: When to Take Profits on an Options Trade (Before It’s Too Late)
- Part 42: When to Cut a Losing Options Trade (Before It Goes to Zero)
- Part 43: Rolling an Options Position: What It Means and When to Do It
- Part 44: Liquidity in Options: Why It Matters More Than Beginners Think (you are here)
⚡ Key Takeaways
- Liquidity tells you how quickly and fairly you can buy or sell an option contract without losing money to wide price gaps.
- Trading illiquid contracts causes severe slippage, meaning you pay too much to get in and get paid too little to get out.
- Always verify the bid-ask spread and daily activity before entering any trade to avoid getting stuck in a position you cannot close.
— Ben, Find Better Trades
Most beginners spend all their energy picking the right stock direction and completely ignore whether anyone is actually trading the contract they want to buy. Welcome to Part 44 of our beginner options series, where we examine why liquidity is the invisible factor that makes or breaks your trading account.
I have watched countless new traders find an option that looked like a bargain on paper, only to realize later that they could not exit the position without handing over half their profit to market makers. Let us make sure that never happens to you.
What Is Liquidity in Options Trading?
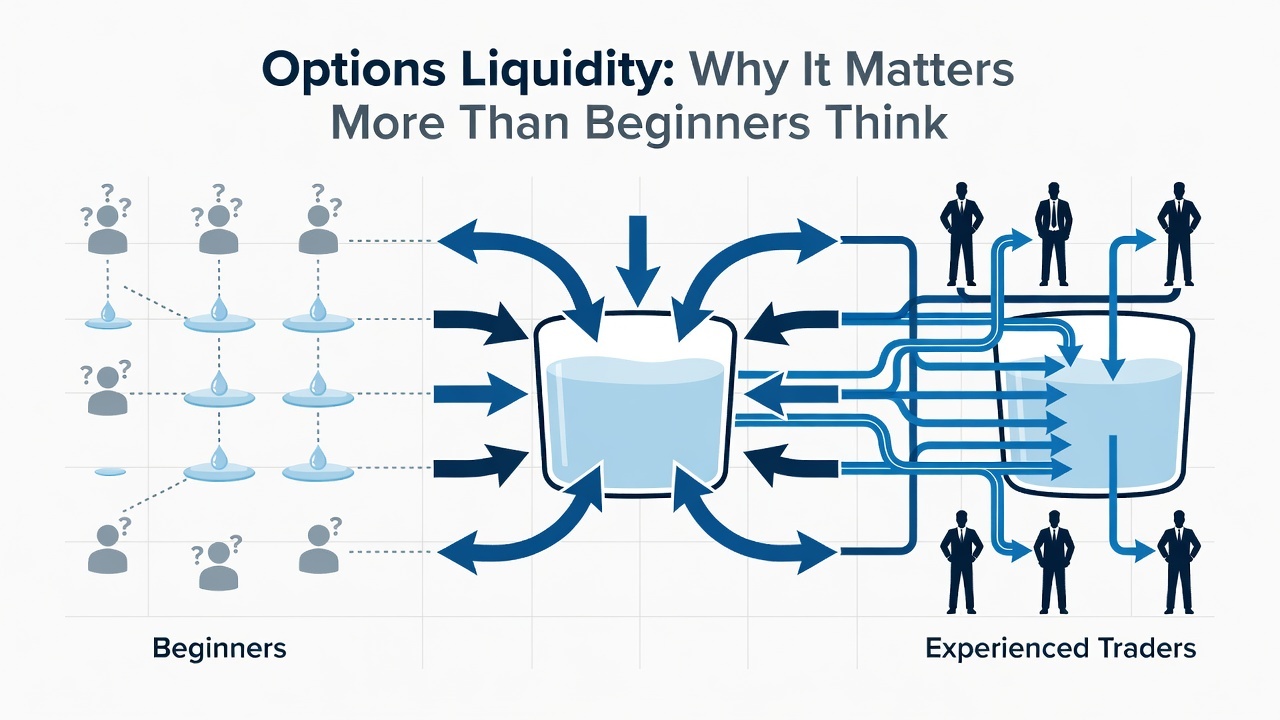
In simple terms, liquidity measures how easily you can convert an asset into cash at a fair, competitive market price. When an asset is liquid, there are thousands of buyers and sellers actively placing orders at every second of the trading day.
When you trade shares of a massive company, liquidity is almost invisible because millions of shares trade every hour. If you want to sell 100 shares, someone is always standing right there ready to take them off your hands.
Options contracts are very different because each stock has dozens of strike prices and expiration dates. A company might have one single ticker symbol for its stock, but it might have several hundred distinct options contracts trading simultaneously.
That means trading interest gets split across all those different strikes and expirations. Some contracts see hundreds of thousands of trades a day, while other contracts on the very exact same stock might sit with zero trades for weeks.
When an option contract has high liquidity, you can enter and exit in a fraction of a second at fair prices. When an option has low liquidity, you are forced to accept bad prices just to get your order filled.
The Real Cost of Illiquidity: The Bid-Ask Spread Trap
Back in Part 13, we covered how the bid price is the highest price a buyer will pay, while the ask price is the lowest price a seller will accept. The gap between those two numbers is the bid-ask spread, and it represents the direct friction cost of entering any trade.
On highly liquid contracts, the spread is tight—often just one penny wide. On illiquid contracts, the spread can easily be $0.50, $1.00, or even wider, which acts like an immediate penalty on your trade.
Let us look at a concrete example to see how this damages your account. Suppose you want to buy a call option on a small-cap biotech stock trading at $30.
The options chain shows a bid price of $2.00 and an ask price of $2.80. Because you are buying, you have to pay the ask price of $2.80 per share, which comes out to $280 for one contract.
The instant your order fills, the true market value of your contract is marked at the midpoint of $2.40, or the current bid of $2.00 if you had to sell immediately. If you decided to close the trade five seconds later without the stock moving an inch, the best price you could sell for is the bid of $2.00 ($200).
You just lost $80 on a $280 trade, which is an immediate 28.5% loss purely due to the wide spread. That is money you must make back on the stock move just to break even.
Free For Traders
One Clear Arrow. Every High-Probability Setup. Free.
The Fusion Indicator combines multiple signals into a single buy/sell arrow on TradingView so you never miss a move.
 → Get The Free Fusion Indicator
The Pawn Shop Analogy: Understanding Liquidity
To grasp why this spread exists, think about selling items in everyday life. Imagine you own a standard, one-ounce pure gold coin that is worth exactly $2,000 based on the spot price of gold.
Because gold is universally recognized and has millions of eager buyers, you can walk into any coin dealer in the world and sell it for $1,990 instantly. The dealer takes a tiny $10 cut because they know they can resell the coin five minutes later to another buyer.
Now imagine you own a rare, antique, hand-carved wooden clock from the 1800s that is theoretically appraised at $2,000. If you need cash this afternoon and take that clock to a local pawn shop, the owner will not offer you $1,990.
The pawn shop owner might only offer you $900 because they know that clock might sit on their shelf collecting dust for two years before an interested collector walks through the door. The pawn shop owner demands a massive profit margin to take on the risk of holding an asset that is difficult to sell.
Market makers in options operate exactly like that pawn shop owner. When an option contract has almost no trading volume, market makers widen their quotes to protect themselves against getting stuck with an unwanted contract.

How Illiquidity Traps You in a Winning Trade
The most painful lesson for a beginner is being completely right about a stock’s direction and still losing money because of illiquidity. Imagine you bought a put option on a retail stock for $1.50 with a bid of $1.00 and an ask of $2.00.
Over the next two days, the stock drops sharply just as you predicted. Your trading software displays a theoretical value of $3.50 for your contract, showing you a handsome profit on your screen.
However, when you pull up the order ticket to close the trade and collect your cash, you look at the real quotes on the chain. The bid is $2.20 and the ask is $4.80 because there are still no active traders on that specific strike.
If you submit a limit order to sell at $3.50, your order sits open and untouched because no real buyers exist at that price. To actually get your cash out before the stock bounces back, you are forced to hit the market maker’s low bid of $2.20.
Instead of capturing your rightful $200 gain, you walk away with a modest $70 gain after taking all that risk. In worst-case scenarios with zero bids on the board, you literally cannot sell your contract at any price before expiration.
Why Stock Liquidity Does Not Equal Option Liquidity
A classic beginner assumption is believing that if a stock trades millions of shares per day, all of its options must be safe and liquid. That is simply not true, and relying on that assumption will cost you money.
Even on mega-cap stocks with enormous trading volume, liquidity is concentrated in specific strikes and expiration cycles. Traders heavily favor at-the-money strikes and near-term monthly or weekly expirations.
If you look at deep out-of-the-money strikes that expire two years from now (known as LEAPS), the trading activity drops dramatically. You will often find wide bid-ask spreads on those contracts even if the underlying company is a household name.
On mid-cap or smaller stocks, this contrast becomes even more extreme. A stock might trade 2 million shares a day with a one-cent spread on the stock itself, but its options chain might be a ghost town with spreads equal to 30% of the contract value.
You must evaluate the liquidity of the specific options contract you want to trade, not just the company whose name is on the ticker symbol.
From Find Better Trades
Only Trade When Momentum Is HEAVILY In Your Favor
The Power Index oscillator measures trend conviction at a glance — it filters out weak, choppy action so you only take the strong moves.
 → See The Power Index
How to Check an Option’s Liquidity Before Placing an Order
Before you ever click the buy or sell button on an options trade, you need a quick system to verify that the contract has sufficient liquidity. I use a simple set of checks every single time I evaluate a trade setup.
First, check the bid-ask spread width as a percentage of the option price. Take the difference between the ask and the bid, then divide it by the ask price. As a general rule, you want the spread to be less than 5% to 10% of the total option value.
Second, look at the volume and open interest on that specific strike. Volume shows how many contracts changed hands today, while open interest shows the total number of active, open contracts that currently exist.
Third, verify if the options trade in penny increments. Highly liquid index and stock options trade in one-cent price steps, whereas illiquid options trade in nickel ($0.05) or dime ($0.10) increments, which inherently widens your slippage.
| Liquidity Rating | Bid-Ask Spread | Open Interest | Typical Action |
|---|---|---|---|
| Great | $0.01 to $0.05 | 1,000+ contracts | Safe to trade with standard limit orders. |
| Moderate | $0.05 to $0.15 | 100 to 1,000 contracts | Trade carefully; work midpoint limit orders. |
| Poor (Illiquid) | $0.25 to $1.00+ | Under 100 contracts | Avoid completely. High risk of getting trapped. |
Worked Example: Liquid Contract vs. Illiquid Contract Math
Let us walk through two separate trades side by side to see how liquidity changes your bottom-line return. In both cases, you have $500 to deploy, and both underlying stocks move favorably by 5% over the next week.
In Trade A, you buy a call option on a highly liquid exchange-traded fund. The bid is $4.95 and the ask is $5.00, meaning you pay $5.00 ($500 for one contract) with a spread cost of only $0.05.
When the fund moves up 5%, the option value increases to $6.20. Because the market is liquid, the new bid is $6.18 and the ask is $6.22, so you sell at the bid of $6.18 to collect $618, earning a clean profit of $118 ($23.6% return).
In Trade B, you buy a call option on an illiquid regional bank stock. The bid is $4.20 and the ask is $5.00, meaning you pay $5.00 ($500 for one contract) with a massive $0.80 spread.
The stock rises by the identical 5%, pushing the theoretical value of the contract to $6.20. However, the new illiquid quotes on the board are a bid of $5.30 and an ask of $7.10.
You sell at the bid of $5.30 to exit your position and receive $530. Even though your stock analysis was flawless, your net profit is only $30 ($6.0% return) because the bid-ask spread swallowed $88 of your real gains.
| Metric | Liquid Trade A | Illiquid Trade B |
|---|---|---|
| Purchase Price (Ask) | $5.00 ($500) | $5.00 ($500) |
| Fair Contract Value at Exit | $6.20 ($620) | $6.20 ($620) |
| Actual Sale Price (Bid) | $6.18 ($618) | $5.30 ($530) |
| Net Profit | +$118 (+23.6%) | +$30 (+6.0%) |
Common Mistakes Beginners Make With Options Liquidity
Using Market Orders on Options Chains: Beginners who are used to buying stocks often place market orders on options. In an illiquid market, a market order will instantly fill at the worst possible price, handing an instant loss to your account. Always use limit orders so you control the exact price you pay.
Confusing Stock Volume With Option Volume: Just because a company trades millions of shares every day does not mean its options are active. Always check the specific expiration date and strike price volume before entering any trade.
Ignoring the Spread Percentage: A $0.20 spread might sound small in dollars, but on a $0.80 option, that represents a 25% penalty right out of the gate. Always calculate the spread relative to the total price of the option contract.
Holding Far Out-of-the-Money Strikes With Zero Open Interest: Traders love buying very cheap contracts for $0.05 or $0.10, but these deep out-of-the-money options often have zero buyers. If the stock makes a modest move, you will find no one willing to buy those contracts from you.
Trying to Trade Illiquid Multi-Leg Strategies: Complex trades like iron condors or vertical spreads require executing two or four options legs simultaneously. If those legs are illiquid, the combined spread friction multiplies, practically guaranteeing a poor entry price.
Frequently Asked Questions About Options Liquidity
What is a good bid-ask spread for an options contract?
A great bid-ask spread is typically between $0.01 and $0.05 wide, which is common on active index funds and large-cap stocks. If the spread is wider than 10% of the total option premium, the trade becomes significantly harder to make profitable.
Can I get stuck in an options contract and not be able to sell it?
Yes, if an option has zero open interest and no active buyers, the bid price can drop to $0.00. In that situation, you cannot sell the contract on the open market and must either wait for expiration or exercise your rights if the option is in the money.
How much open interest should an option have before I trade it?
A practical guideline for beginners is to look for contracts with at least 500 to 1,000 contracts in open interest. Higher open interest signals that other traders and institutions are actively involved in that strike, ensuring smoother fills.
Why are market makers allowed to create such wide spreads?
Market makers risk their own capital to provide quotes when no other retail traders are active. If a contract is risky or rarely traded, they widen their bid and ask prices to compensate themselves for the danger of holding illiquid inventory.
Next up in Part 45, we are taking a closer look under the hood at open interest vs. volume so you can tell whether fresh money is entering a trade or old positions are quietly closing out.
📈 Want More? Join Our Free Trading Community
- Trading Strategy Guides Telegram — daily strategy tips and market insights
- Find Better Trades Telegram — free trade signals delivered to your phone
- Find Better Trades on YouTube — live trade breakdowns and tutorials
Lesson 44 of 55 in the free Options Trading Course.
← Previous: Rolling an Options Position: What It Means and When to Do It
Next: Open Interest vs Volume in Options: What Each One Tells You →