What Is Implied Volatility? Options Beginner Guide

📚 Beginner’s Guide to Options — Part 14 of 51
- Part 1: What Is an Option? The Absolute Basics Explained
- Part 2: Calls vs. Puts: The Two Types of Options You Need to Know
- Part 3: Strike Price Explained: What It Actually Means for Your Trade
- Part 4: Expiration Date Explained: Why It Changes Everything
- Part 5: Premium Explained: What You’re Really Paying For
- Part 6: In the Money vs. Out of the Money: A Beginner’s Breakdown
- Part 7: Intrinsic Value vs. Extrinsic Value: What Makes Up an Option’s Price
- Part 8: How Buying a Call Option Works, Step by Step
- Part 9: How Buying a Put Option Works, Step by Step
- Part 10: What Happens When an Option Expires? Every Outcome Explained
- Part 11: Options Contracts 101: What One Contract Actually Represents
- Part 12: How to Read an Options Chain Without Getting Overwhelmed
- Part 13: Bid, Ask, and Spread: What They Mean When You’re Trading Options
- Part 14: What Is Implied Volatility? A Beginner’s Plain-English Guide (you are here)
⚡ Key Takeaways
- Implied volatility measures expected future stock movement priced directly into options premiums.
- Higher implied volatility expands extrinsic value, making both call and put options more expensive.
- Checking IV Rank prevents you from buying overvalued options right before major events like earnings.
— Ben, Find Better Trades
Welcome to Part 14 of our 51-part options trading series. If there is one core concept that separates confused beginners from consistent traders, it is implied volatility. I remember buying my first call option years ago, watching the stock go up, and still losing money because I did not understand how this single metric worked.
What Is Implied Volatility in Plain English?
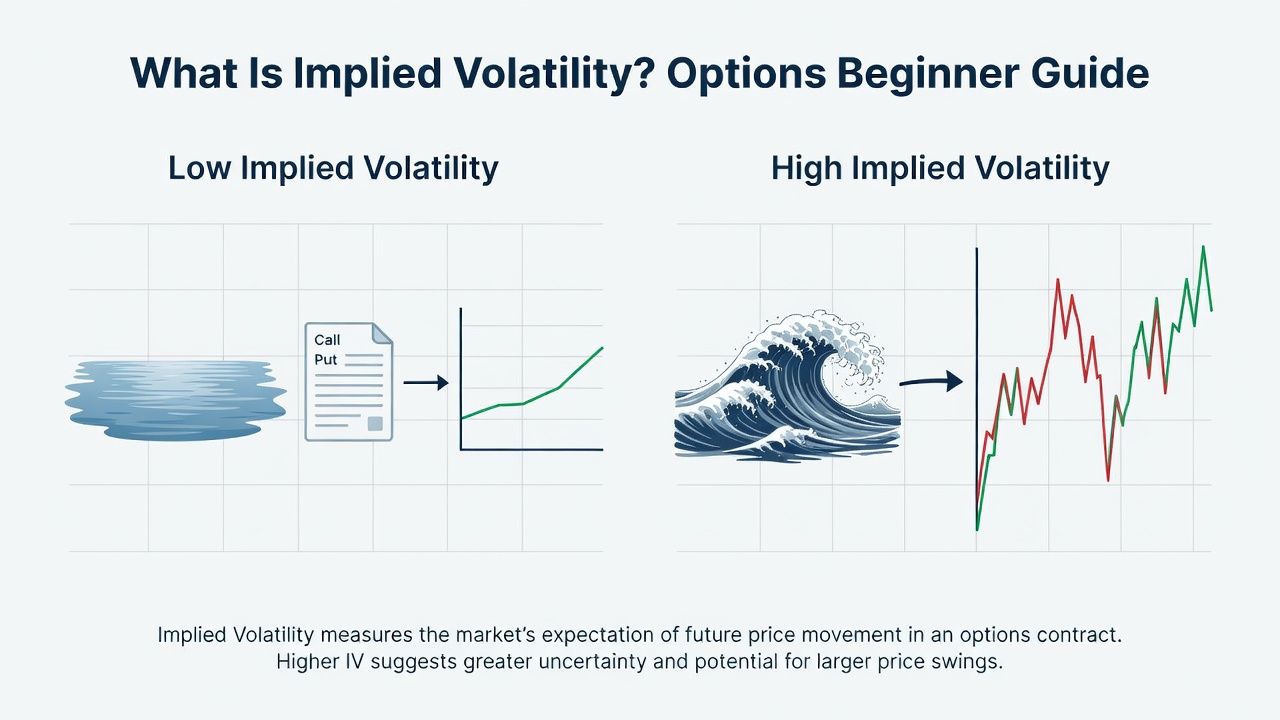
Implied volatility, often abbreviated as IV, is a percentage that estimates how much a stock price might fluctuate in the future. It does not measure what a stock did yesterday or last month.
Instead, implied volatility looks entirely forward. It represents the collective belief of all buyers and sellers in the options market right now.
In Part 7 of our series, we covered intrinsic value versus extrinsic value. You learned that extrinsic value is the time and uncertainty premium built into an option price.
Implied volatility directly dictates how large that extrinsic value component becomes. When IV rises, extrinsic value inflates and option prices climb across the board.
When IV falls, extrinsic value shrinks, causing option prices to drop even if the underlying stock price does not move at all. It acts as a financial speedometer for market risk expectations.
Understanding this metric is crucial because it explains why option prices change independent of stock price movement. Without IV, option pricing makes very little sense to a new trader.
Historical Volatility vs. Implied Volatility: What Is the Difference?
To master implied volatility, you must distinguish it from historical volatility. Historical volatility looks backward at factual price data from past trading sessions.
It calculates how much a stock actually bounced around over the last thirty, sixty, or ninety days. It is a mathematical recording of past events.
Implied volatility looks forward through the front windshield. It measures the supply and demand for options contracts based on upcoming uncertainty.
When traders expect a major event, they buy options contracts en masse to hedge risk or speculate. That high demand drives up option premiums, pushing implied volatility higher.
Think of historical volatility as measuring how much rain fell yesterday afternoon. Implied volatility is the percentage chance of a thunderstorm in tomorrow forecast.
A stock can trade in a completely flat line for three months, producing near-zero historical volatility. But if an FDA drug announcement happens tomorrow morning, implied volatility will skyrocket today in anticipation of that move.
Free For Traders
One Clear Arrow. Every High-Probability Setup. Free.
The Fusion Indicator combines multiple signals into a single buy/sell arrow on TradingView so you never miss a move.

How Implied Volatility Drives Option Prices Up and Down
Implied volatility serves as the main driver of option extrinsic value. When IV climbs, both call options and put options become more expensive at the exact same time.
When IV drops, both call options and put options lose value simultaneously. Many new traders incorrectly assume that rising volatility only helps put buyers, but that is a myth.
Because options grant the right to profit from stock price movement, greater expected uncertainty increases the value of that right. Option sellers demand higher compensation to accept the risk of wild stock swings.
Here is a detailed comparison table showing how IV changes alter contract prices when the stock price remains unchanged at $100:
| Market Environment | Implied Volatility (IV) | $100 Strike Call Premium | $100 Strike Put Premium |
|---|---|---|---|
| Quiet Market Conditions | 20% | $2.50 | $2.50 |
| Upcoming Product Launch | 50% | $5.80 | $5.80 |
| Post-Event Calming | 18% | $2.20 | $2.20 |
Look closely at how the call and put premiums expand together when IV moves from 20% to 50%. The stock price stayed fixed at $100 the entire time.
The price expansion was caused entirely by option market participants bidding up extrinsic value. That is why IV is often described as the pricing power of options.

The Hurricane Analogy: How Fear Changes Option Premiums
Let’s use a simple real-world analogy to lock this concept in place. Imagine you are buying hurricane insurance for a home located near the coast.
In late spring, when weather forecasts are clear and sunny, insurance coverage might cost $150 per month. The probability of severe property damage in the next week is close to zero.
Now imagine a massive storm forms in the ocean and heads straight toward your town. The risk of major damage occurring over the next forty-eight hours suddenly jumps.
If you try to buy insurance while that storm is bearing down on your house, the insurance provider will charge you $1,500 instead of $150. Your physical house did not change, but the uncertainty surrounding it exploded.
In options trading, high implied volatility represents that impending storm. Option sellers are insurance writers who raise their prices when major events threaten to cause wild stock moves.
Once the storm passes by without hitting the town, the immediate danger drops back to zero. Insurance prices collapse back down to normal levels instantly, just like option premiums do after big events.
How to Read Implied Volatility Numbers on Your Trading Screen
When you open your platform options chain, which we learned to read back in Part 12, IV appears as a percentage next to expiration dates. Every expiration cycle has its own specific IV number.
For instance, an option chain might list an annualized IV of 32% for contracts expiring in thirty days. That percentage reflects one standard deviation of expected movement over a full year.
While you do not need an advanced math degree to trade options, knowing how to interpret this number is vital. A quick shortcut is dividing the annualized IV by sixteen to estimate the expected daily percentage move.
Here is a breakdown translating annualized implied volatility percentages into practical expectations for a $100 stock:
| Annualized IV | Approximate Daily Expected Move | 1-Year Expected Stock Range |
|---|---|---|
| 16% | ~1.0% per day | $84 to $116 |
| 32% | ~2.0% per day | $68 to $132 |
| 64% | ~4.0% per day | $36 to $164 |
If a $100 stock displays an annualized IV of 32%, the market estimates a 68% probability that the stock will end the year between $68 and $132.
Short-dated options surrounding earnings reports or clinical trial results can show IV readings well above 100%. That tells you the market expects massive short-term turbulence.
From Find Better Trades
Only Trade When Momentum Is HEAVILY In Your Favor
The Power Index oscillator measures trend conviction at a glance — it filters out weak, choppy action so you only take the strong moves.


Real-World Numeric Example: The Earnings Report Effect
Let’s walk through our first complete numeric example to see how IV crush plays out in practice. Suppose XYZ stock is trading at $50 per share two days before an earnings report.
You decide to buy a $50 strike call option expiring in seven days. Because the earnings announcement carries huge uncertainty, the implied volatility on this contract sits at 80%.
With IV at 80%, the option premium costs $4.00 per contract ($400 total cost). As we covered in Part 7, this entire $4.00 is extrinsic value because the stock is at the $50 strike price.
The next morning, XYZ reports strong earnings, and the stock price jumps $2.00 to trade at $52.00 per share. You might expect your call option to show a nice profit.
However, because the event is over, uncertainty disappears completely. Implied volatility plummets overnight from 80% down to 25%.
At $52.00 per share, your $50 call option now holds $2.00 of intrinsic value. But with IV down at 25%, the remaining extrinsic value collapses from $4.00 down to $0.40.
Your contract is now worth only $2.40 ($2.00 intrinsic + $0.40 extrinsic). Even though the stock moved $2.00 in your favorable direction, you lost $1.60 per contract ($160 total loss) because IV collapsed.
IV Rank and IV Percentile: Knowing If Volatility Is High or Low
Looking at a standalone IV percentage like 35% can be deceiving. An IV of 35% might be extremely high for a stable utility company, but surprisingly low for a high-growth tech stock.
To solve this problem, experienced traders rely on two relative metrics: IV Rank and IV Percentile. These indicators benchmark current IV against a stock own 52-week volatility range.
Let’s walk through our second numeric example to calculate IV Rank step by step. Suppose stock ABC has traded over the past year with a minimum IV of 20% and a maximum IV of 60%.
Today, stock ABC shows a current implied volatility reading of 40%. We want to determine where 40% sits within its historical range of 20% to 60%.
The math is simple: subtract the 52-week low (20%) from the current IV (40%), which equals 20%. Then divide that by the total 52-week range (60% minus 20%, which equals 40%).
Dividing 20 by 40 gives 0.50, meaning ABC stock currently has an IV Rank of 50%. This tells us volatility sits right in the middle of its annual range.
If IV Rank rises above 80%, option premiums are historically expensive. If IV Rank drops below 20%, option premiums are historically cheap relative to that specific stock history.
Common Mistakes Beginners Make With Implied Volatility
Buying option contracts immediately before earnings without checking IV is a classic beginner mistake. Traders buy calls expecting positive news, only to lose money from IV crush when volatility collapses post-earnings.
Another common error is treating high implied volatility as a directional forecast. High IV means the market expects a large move, but it does not indicate whether the stock will jump up or crash down.
New traders also frequently mistake implied volatility for guaranteed movement. High IV simply reflects uncertainty and market demand for contracts, not a promise that the stock will actually move significantly.
Finally, beginners often compare raw IV percentages between completely different asset classes. Comparing a speculative penny stock with 120% IV to a market index ETF with 15% IV provides no value without using IV Rank to standardize the context.
Frequently Asked Questions About Implied Volatility
Does high implied volatility mean I should buy or sell options? High implied volatility means option premiums are expensive, which generally favors selling options strategies to collect inflated premiums. When implied volatility is low, options are relatively cheap, making option buying strategies more attractive from a value perspective.
Why did my option lose money even though the stock moved the right way? This usually happens because of IV crush, where implied volatility drops rapidly after an expected event passes. If the loss of extrinsic value caused by falling IV exceeds the gain in intrinsic value from stock movement, your position suffers a net loss.
Where can I find implied volatility figures on my brokerage screen? Most major trading platforms display implied volatility directly within the options chain alongside each expiration date. You can also customize your quote display to show stock-level IV and 52-week IV Rank metrics.
Does implied volatility impact calls and puts in the same way? Yes, changes in implied volatility push both call option and put option premiums in the same direction at the same time. Rising IV inflates extrinsic value for both calls and puts, while falling IV shrinks extrinsic value across all contracts.
Now that you understand how implied volatility expands and contracts option premiums, you are ready for Part 15, where we explore the relentless daily price decay that erodes contract value every single afternoon: time decay and Theta.
📈 Want More? Join Our Free Trading Community
- Trading Strategy Guides Telegram — daily strategy tips and market insights
- Find Better Trades Telegram — free trade signals delivered to your phone
- Find Better Trades on YouTube — live trade breakdowns and tutorials