Why Doji Candles Are Almost Always Misread by Retail Traders

📊 September 19, 2026
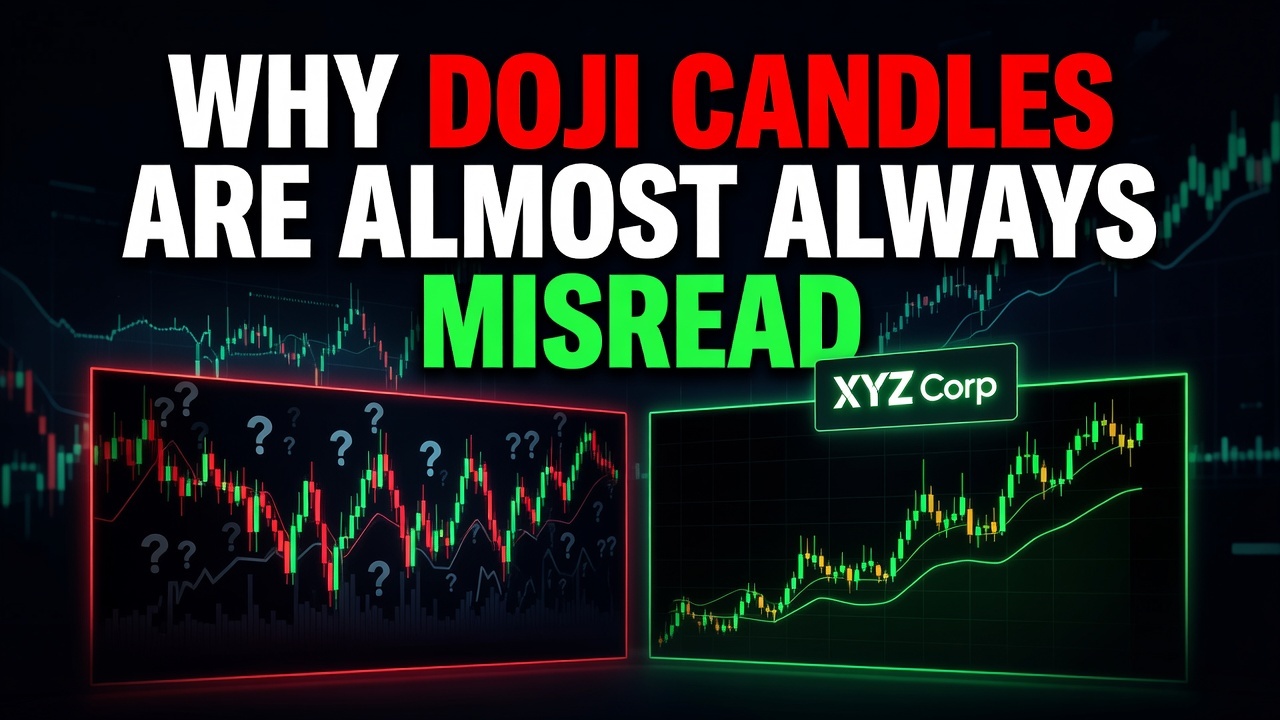
- A Doji is not an automatic reversal trigger; it is merely a temporary pause in order flow that retail traders routinely misuse.
- The biggest mistake is front-running a reversal on a single neutral bar, which turns your stop into exit liquidity for the dominant trend.
- Mark the Doji high and low as a liquidity bracket, then trade the structural breakout or sweep heading into next week.
— Ben, Find Better Trades
Every generic trading textbook sells you the exact same fantasy: spot a Doji after a strong run, and you have miraculously caught the top. It is lazy technical analysis, and it is one of the fastest ways retail accounts get drained.
A Doji does not mean the trend is dying. It simply means buyers and sellers matched orders at that specific price level for a brief slice of time.
Why Everyone Gets This Wrong
Retail traders hear the word indecision and instantly hallucinate a reversal. They see a market climb 200 points, spot a candle where open and close meet, and immediately slap down a counter-trend short.
Think about what actually happens beneath the surface. In a powerful trend, a Doji is almost never a structural turning point; it is a breather where institutional buyers absorb supply before driving price higher.
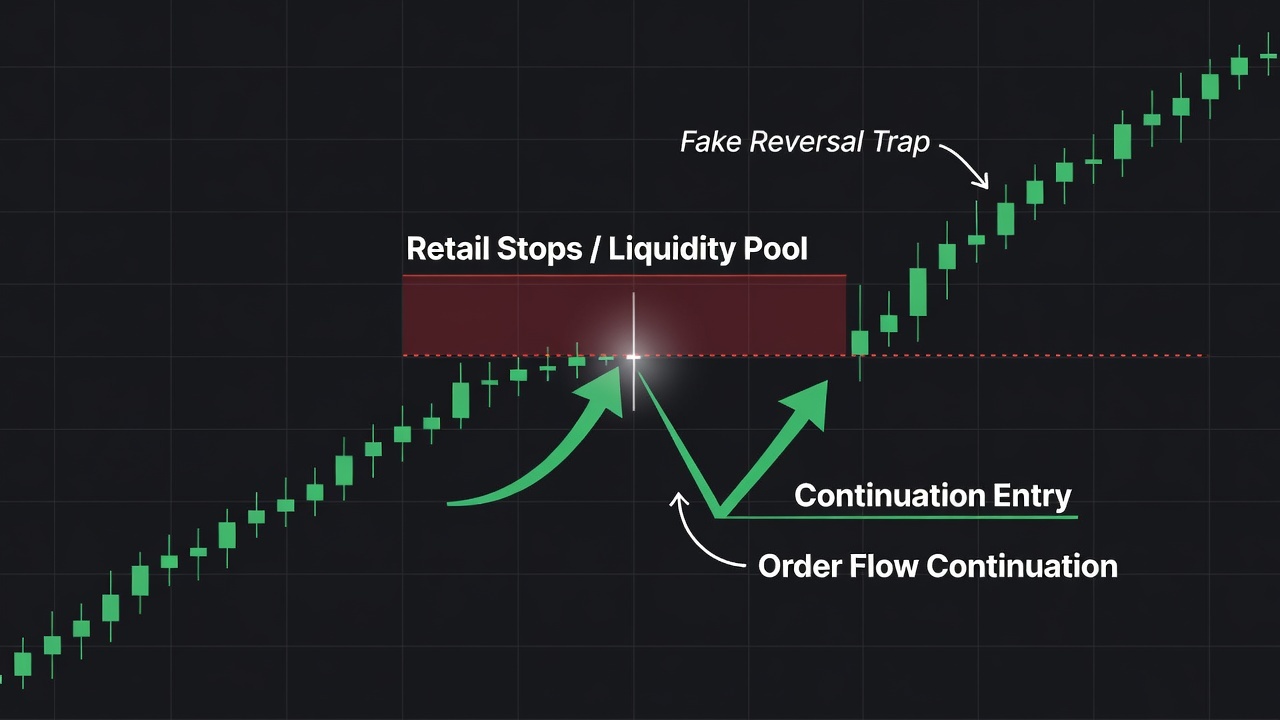
Because retail traders love setting stops just above the Doji’s upper shadow, they build a massive cluster of resting buy stops. When markets push forward, smart money runs right through that high, triggers the stops for exit liquidity, and leaves premature shorters holding a loss.
What Actually Works
Stop treating a single candle as an execution trigger. Over the weekend, pull up your charts and mark the high and the low of any prominent Doji as a liquidity range.
When markets open Monday, watch how price interacts with the boundary rather than jumping in blindly. If price drives past the Doji high, fails to sustain acceptance, and violently snaps back inside the range, you have a sweep setup worth taking.
More often than not, you will see the breakout hold. A clean break and structural retest of the Doji’s extreme in the direction of the dominant trend offers a high-probability continuation entry that retail traders completely ignore.
When Doji Candles Can Still Help
A Doji carries diagnostic weight only when it collides with a major higher-timeframe inflection point. If price pushes into a multi-month supply zone, shows severe volume exhaustion, and then prints a Doji, you can treat it as an early alert to pay attention.
Even in that scenario, the Doji is never the trigger. The trigger is the subsequent candle breaking market structure and displacing lower, proving that institutional sellers have actually stepped onto the field.
🎯 Want Setups Like These? The Big Dipper Does the Scanning For You.
Every morning the Big Dipper delivers curated DIP ZONE trade ideas — stocks already at high-probability entry levels, with targets pre-set. No guessing, no scanning. Just setups.


Doji Candle FAQ
Q: Does a Doji candle always signal a trend reversal?
A: No, a Doji signals temporary equilibrium between buyers and sellers, which statistically resolves in trend continuation far more often than an outright reversal.
Q: How should I trade a Doji heading into next week?
A: Do not trade the candle itself; instead, wait for Monday’s price action to break outside the Doji’s high or low to confirm whether buyers or sellers maintain structural control.
Free For Traders
Get Free Weekly Trade Ideas Sent Straight To Your Phone
Join thousands of traders who get high-probability setups delivered every week — no cost, no catch.

From Find Better Trades
Stop Drawing Trendlines By Hand. Seriously.
Terraline auto-draws algorithmic trendlines that adjust in real time — perfectly connecting the swings you’d spend hours finding manually.

📈 Want More? Join Our Free Trading Community
- Trading Strategy Guides Telegram — daily strategy tips and market insights
- Find Better Trades Telegram — free trade signals delivered to your phone
- Find Better Trades on YouTube — live trade breakdowns and tutorials