RSI Divergence at Resistance: The Only Way It Actually Pays

📊 September 16, 2026
- RSI divergence is completely useless in a vacuum and only prints money when anchored to higher-timeframe resistance.
- Retail traders short the first sign of divergence in an active trend and get liquidated as momentum resets without price dropping.
- Wait for price to tap structural resistance, look for the lower high on RSI, and demand an internal market structure break before entering.
— Ben, Find Better Trades
Trading RSI divergence by itself is one of the fastest ways to bleed a trading account to zero. Retail traders treat every sub-70 oscillator tick like an engraved invitation to fade a bull market, and institutional desks happily take their liquidity every single day. If you want this setup to actually pay your bills, you must stop treating the RSI like an entry trigger and start treating it like a confirmation filter at major structural levels.
Why Everyone Gets This Wrong
The standard textbook advice tells you to spot a higher high in price, locate a lower high on the 14-period RSI, and slam the short button. It sounds clean in theory, but on a live chart, strong trends eat regular bearish divergence for breakfast.
Think about how a trending market behaves when institutions are building positions. Price pushes higher, RSI tags 80, and then price consolidates sideways for three narrow-range candles while RSI drifts down to 55. That is not a reversal; that is a textbook momentum reset before the next 10% rip straight through your stop loss.
Oscillators measure the velocity of price change over a lookback period, not valuation and certainly not supply. When you bet against a runaway market just because a squiggly line is sloping down, you are stepping in front of a freight train with a clipboard. Without horizontal structural context to halt the auction, divergence is meaningless noise.
What Actually Works
The setup that pays requires three strict filters, starting with higher-timeframe horizontal resistance. You do not touch the RSI until price reaches an undisputed daily or four-hour supply zone where sellers have demonstrated genuine historical commitment.
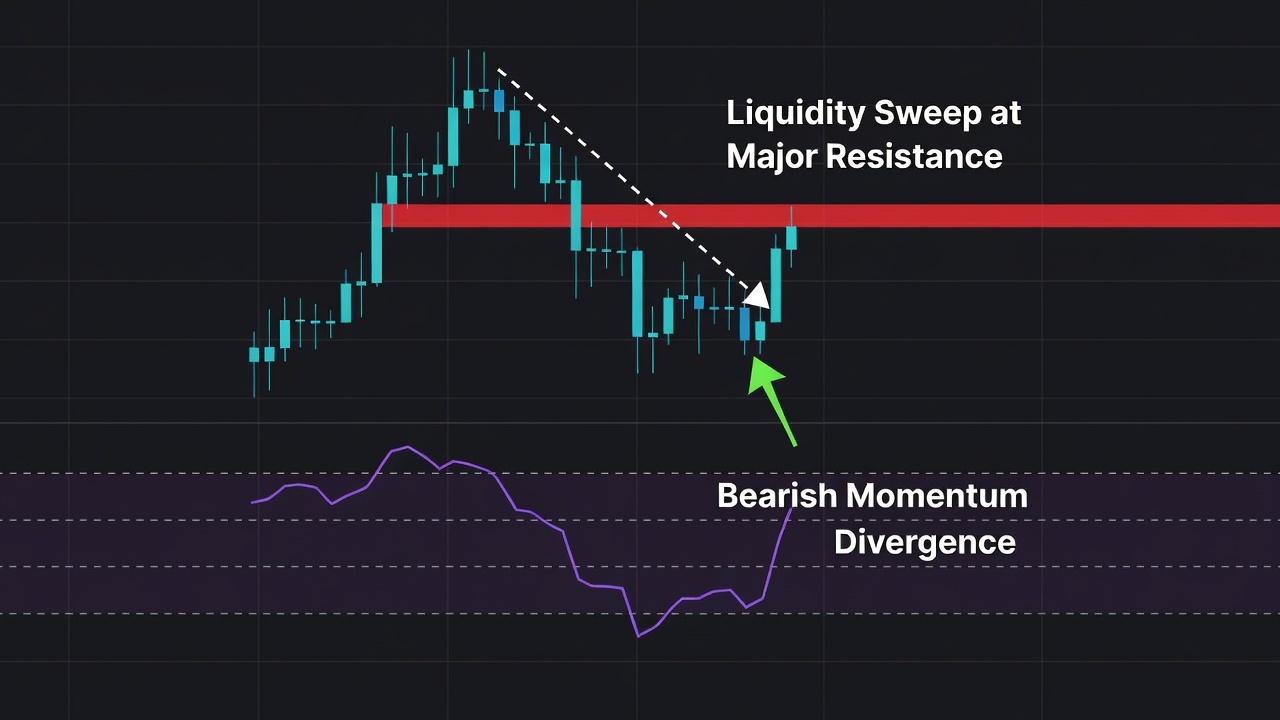
Once price arrives at that level, you look for a two-drive pattern into the zone. The first drive tests the level and establishes the high water mark for momentum, while the second drive pushes marginally higher to sweep resting buy-stops above the resistance ceiling. That second poke must show a visibly lower high on the RSI, proving that the breakout was fueled by trapped buyers rather than genuine institutional aggression.
Here is the critical rule: you never short the divergence candle itself. You drop down to the execution timeframe and wait for an internal structure break, meaning a candle close below the swing low that formed between the two divergence peaks. Your risk goes above the sweep high, and your target sits at the nearest opposing liquidity pool.
When RSI Divergence Can Still Help
RSI divergence is not entirely broken; it is just wildly misapplied by traders who refuse to look at horizontal price structure. When used strictly as a warning signal, it excels at telling you when to tighten trailing stops on your winning long trades.
If you are holding a long from lower levels and price hits key resistance with screaming bearish divergence, that is your cue to take profits off the table. You do not have to short the asset, but you must respect that the buyers are losing their offensive push at the exact area where sellers are waiting to unload inventory.
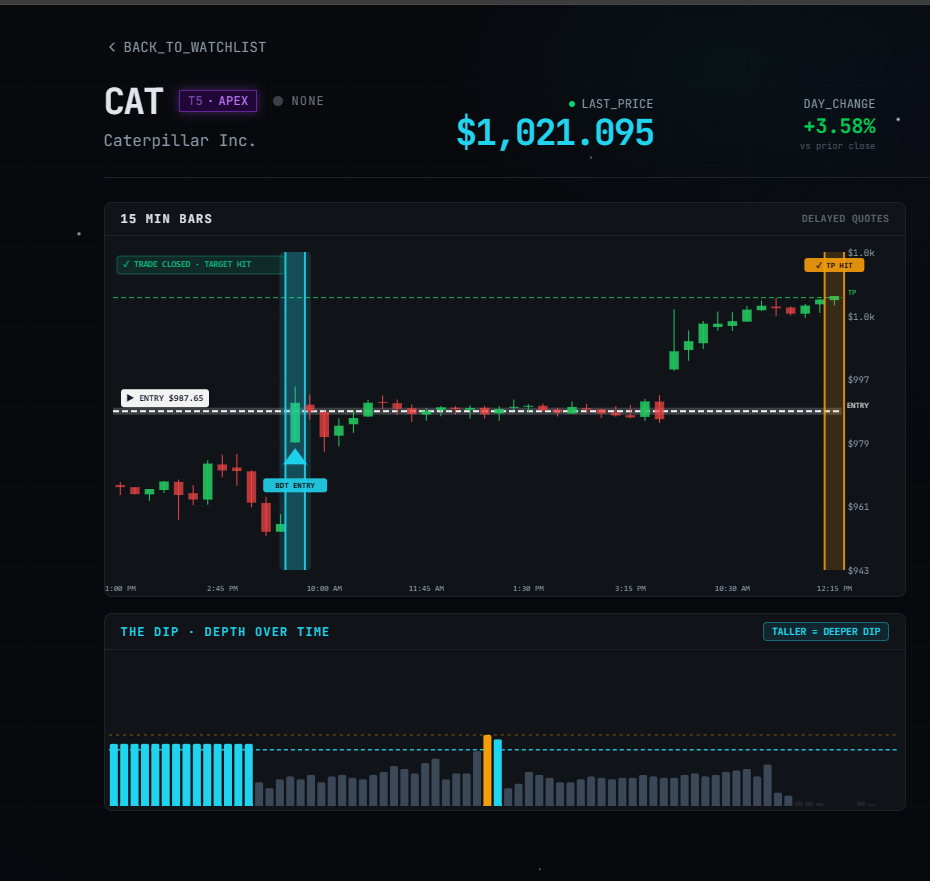
🎯 Want Setups Like These? The Big Dipper Does the Scanning For You.
Every morning the Big Dipper delivers curated DIP ZONE trade ideas — stocks already at high-probability entry levels, with targets pre-set. No guessing, no scanning. Just setups.

RSI Divergence FAQ
Q: Does RSI divergence work on the 1-minute or 5-minute timeframe?
A: No, low-timeframe divergence is mostly execution noise from order routing and minor liquidity sweeps. Find your resistance zone on the 1-hour or 4-hour chart first, then use lower timeframes only for your market structure break entry.
Q: Should I change the default 14-period RSI settings to trade this setup?
A: Stick to the standard 14 period. Tweaking indicator parameters to fit past swings is just curve-fitting that leads to overconfidence on live setups.
Free For Traders
Get Free Weekly Trade Ideas Sent Straight To Your Phone
Join thousands of traders who get high-probability setups delivered every week — no cost, no catch.

From Find Better Trades
Stop Drawing Trendlines By Hand. Seriously.
Terraline auto-draws algorithmic trendlines that adjust in real time — perfectly connecting the swings you’d spend hours finding manually.

📈 Want More? Join Our Free Trading Community
- Trading Strategy Guides Telegram — daily strategy tips and market insights
- Find Better Trades Telegram — free trade signals delivered to your phone
- Find Better Trades on YouTube — live trade breakdowns and tutorials