How to Read an Options Chain Without Getting Overwhelmed

📚 Beginner’s Guide to Options — Part 12 of 51
- Part 1: What Is an Option? The Absolute Basics Explained
- Part 2: Calls vs. Puts: The Two Types of Options You Need to Know
- Part 3: Strike Price Explained: What It Actually Means for Your Trade
- Part 4: Expiration Date Explained: Why It Changes Everything
- Part 5: Premium Explained: What You’re Really Paying For
- Part 6: In the Money vs. Out of the Money: A Beginner’s Breakdown
- Part 7: Intrinsic Value vs. Extrinsic Value: What Makes Up an Option’s Price
- Part 8: How Buying a Call Option Works, Step by Step
- Part 9: How Buying a Put Option Works, Step by Step
- Part 10: What Happens When an Option Expires? Every Outcome Explained
- Part 11: Options Contracts 101: What One Contract Actually Represents
- Part 12: How to Read an Options Chain Without Getting Overwhelmed (you are here)
⚡ Key Takeaways
- An options chain is just an organized menu displaying every call and put contract available for a stock.
- Calls are always listed on the left side, puts sit on the right side, and strike prices run straight down the center spine.
- You can eliminate most screen clutter instantly by selecting one expiration date and hiding columns you do not need.
— Ben, Find Better Trades
When I opened my very first options trading screen years ago, I felt like I was staring at raw digital code in a sci-fi movie. Wall-to-wall numbers, flashing green and red figures, and endless columns made my eyes glaze over instantly.
Welcome to Part 12 of our series, where I am going to teach you how to read an options chain calmly and clearly. Once you understand the basic layout, you will realize it is organized with exact logic.
1. What Is an Options Chain and Why Does It Look So Intimatidating?
An options chain is simply a master matrix showing every option contract available for a specific stock.
When you look up a stock quote, you only see one single number representing the current stock price. An options chain gives you hundreds of price combinations based on different strike prices and expiration dates.
Think of a stock quote as a basic item on a menu, like a plain burger. The options chain is the full custom menu listing every possible topping, side dish, and size available in the restaurant.
Platforms show a massive grid because they try to display call options, put options, strike prices, expiration dates, and trading metrics all on one screen.
It looks intimidating because your brain tries to digest every number at once. The secret to mastering it is learning where to look first and ignoring what you do not need right now.
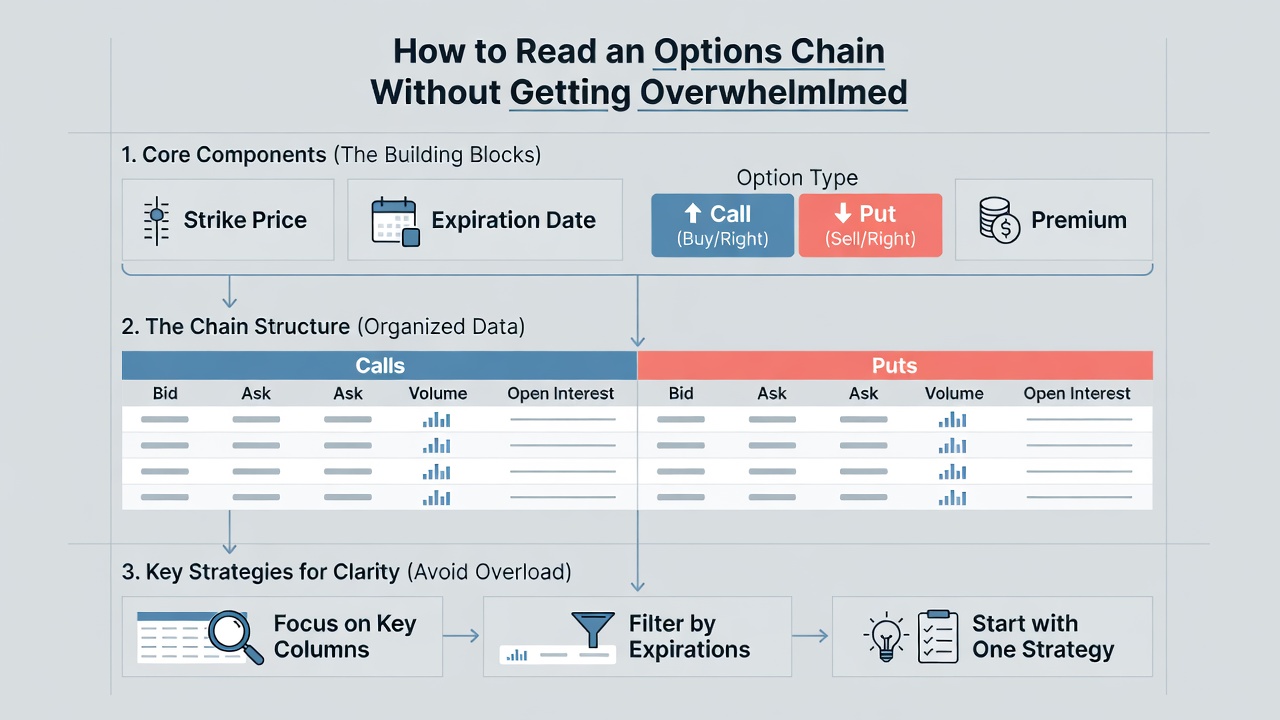
2. The Anatomy of an Options Chain: Calls on the Left, Puts on the Right
Almost every single broker uses the exact same universal layout for their options chain.
The entire screen is split vertically into two main sides down the center of your page.
Call options are strictly located on the left side of the table. Put options are strictly located on the right side of the table.
We covered calls and puts back in Part 2 of this series. As a quick reminder, calls give you the right to buy stock, while puts give you the right to sell stock.
Running straight down the center of the table between the calls and puts is a single column displaying strike prices.
This layout lets you compare a call option and a put option at the exact same strike price by scanning horizontally across the row.
| CALLS (Left Side) | STRIKE PRICE (Center Spine) | PUTS (Right Side) |
|---|---|---|
| Bullish Contracts (Right to Buy) | $100.00 | Bearish Contracts (Right to Sell) |
| Bullish Contracts (Right to Buy) | $105.00 | Bearish Contracts (Right to Sell) |
Free For Traders
Know The EXACT Moment A Stock Hits Support Or Resistance
Real-time alerts fire the instant a stock approaches a critical level. Completely free.

3. Choosing Your Expiration Date First to Filter Out the Noise
The absolute fastest way to clear up confusion on an options chain is to pick your timeline before doing anything else.
Brokers stack options chains inside collapsible dropdown folders categorized by expiration date.
As we learned in Part 4, every contract comes with a specific expiration date that dictates how long the contract stays active.
If you leave every expiration tab open, you will see thousands of contract rows stretch down your screen forever.
Clicking on just one specific date folder instantly hides ninety percent of the distracting data on your screen.
If your trading plan calls for a trade expiring in thirty days, open only that specific date tab and keep all other monthly tabs collapsed.

4. Finding the Strike Price: How the Center Spine Works
Once you open your desired expiration date, your eyes should move directly to the center spine of strike prices.
The strike prices are listed in clean numerical order, starting with lower values at the top and growing higher as you scroll down.
In Part 3, we established that the strike price is the exact price where you hold the right to buy or sell the underlying shares.
Your platform will highlight the stock’s current share price right between the two nearest strike prices on the chain.
If stock XYZ is trading at $102.50 in the real market, the screen will display a highlighted visual line between the $100 strike and the $105 strike.
This visual divider separates in the money options from out of the money options, concepts we broke down in Part 6.
For calls on the left, strikes located above the stock price line are highlighted as in the money.
For puts on the right, strikes located below the stock price line are highlighted as in the money.
5. Reading the Key Columns: Bid, Ask, Last, and Volume
Once you identify your strike price, you read horizontally across the row to see the market data columns.
The two most critical numbers on any row are the Bid and the Ask.
The Bid column tells you the highest price a buyer in the market is willing to pay for that option contract right now.
The Ask column tells you the lowest price a seller in the market is willing to accept for that option contract right now.
You will also see a column labeled Last, which records the price where the most recent transaction occurred.
Do not rely on the Last column for current trading decisions because that specific trade could have occurred hours ago when the stock was at a different price.

6. A Step-by-Step Worked Example: Reading a Real Stock Chain
Let’s work through two simple numeric examples so you can practice reading an options chain step by step.
Suppose stock ABC is currently trading at $50.00 per share, and you want to buy a call option expiring next month.
First, you click on the July expiration tab to open the chain for that specific month.
Second, you locate the $55.00 strike price in the center column spine.
Third, you look to the left side (Calls) across from the $55 strike, where you see a Bid of $1.40 and an Ask of $1.50.
As we covered in Part 11, one contract controls 100 shares, so paying the Ask price of $1.50 means your total contract price is $150.00.
Now let’s examine a second example looking at put options on stock XYZ, which trades at $100.00 per share.
You open the August expiration folder and scroll to the $95.00 strike price in the center column.
You scan to the right side (Puts) across from the $95 strike and see a Bid of $2.10 and an Ask of $2.20.
Buying this put option at the Ask price of $2.20 will require an upfront premium payment of $220.00.
From Find Better Trades
Three Signals Align. Your Phone Buzzes. That’s It.
Trisignal only fires when all three confluence conditions line up — high-probability alerts sent straight to Telegram.

7. Customizing Your View: Hiding Columns You Do Not Need Yet
Most beginners do not realize that brokerage trading platforms let you fully customize what columns appear on your chain.
Default settings on platforms often clutter your view with complex statistics like Delta, Gamma, Theta, and Implied Volatility.
While those analytical tools have their place later in your journey, seeing them on day one only adds unnecessary confusion.
I always instruct new traders to open their chain settings and remove every advanced column from their view.
Simplify your display down to four basic columns: Strike Price, Bid, Ask, and Volume.
Stripping away extra data allows you to focus purely on contract prices without feeling overwhelmed by statistical noise.
Common Mistakes Beginners Make With This
Mistake 1: Relying on the Last price column instead of looking at the current Ask price. The last trade price might be hours old, whereas the Ask price shows what you must actually pay right now to buy the contract.
Mistake 2: Mixing up the left side and right side of the options chain. New traders occasionally buy a put thinking it is a call because they forgot calls sit strictly on the left and puts sit strictly on the right.
Mistake 3: Keeping every expiration date folder open simultaneously. Leaving all dates expanded creates massive visual clutter that leads to accidentally selecting the wrong expiration month for your trade.
Mistake 4: Forgetting to multiply listed screen prices by 100. Seeing a contract price listed as $2.50 means your actual cash outlay is $250.00, not $2.50.
Options Chain Reading FAQ: Clear Answers for Beginners
Why are certain rows shaded in different colors on my options chain?
Shading highlights whether a contract is in the money or out of the money relative to current share prices. Calls with strike prices below the stock price are shaded, while puts with strike prices above the stock price are shaded.
What does it mean when the volume column shows zero for an option strike?
Zero volume means no contracts at that specific strike price have been traded during today’s market session. It does not mean you cannot trade that strike, but it indicates lower market activity for the day.
Are calls always listed on the left side across every broker platform?
Yes, virtually every broker uses this standardized split-screen format. Calls sit on the left, puts sit on the right, and strike prices run down the middle across all major platforms.
How do I choose which expiration date tab to click on first?
Select the expiration date folder that matches how long you expect your trade thesis to play out. If you expect a stock move over the next month, open the expiration date that gives you at least thirty days of time.
Next up in Part 13, we are going to look closely at the Bid, Ask, and Spread so you know exactly how to execute your orders without overpaying.
📈 Want More? Join Our Free Trading Community
- Trading Strategy Guides Telegram — daily strategy tips and market insights
- Find Better Trades Telegram — free trade signals delivered to your phone
- Find Better Trades on YouTube — live trade breakdowns and tutorials