NVDA Just Broke Its 52-Week Low. Options Are Paying Up for Fear.

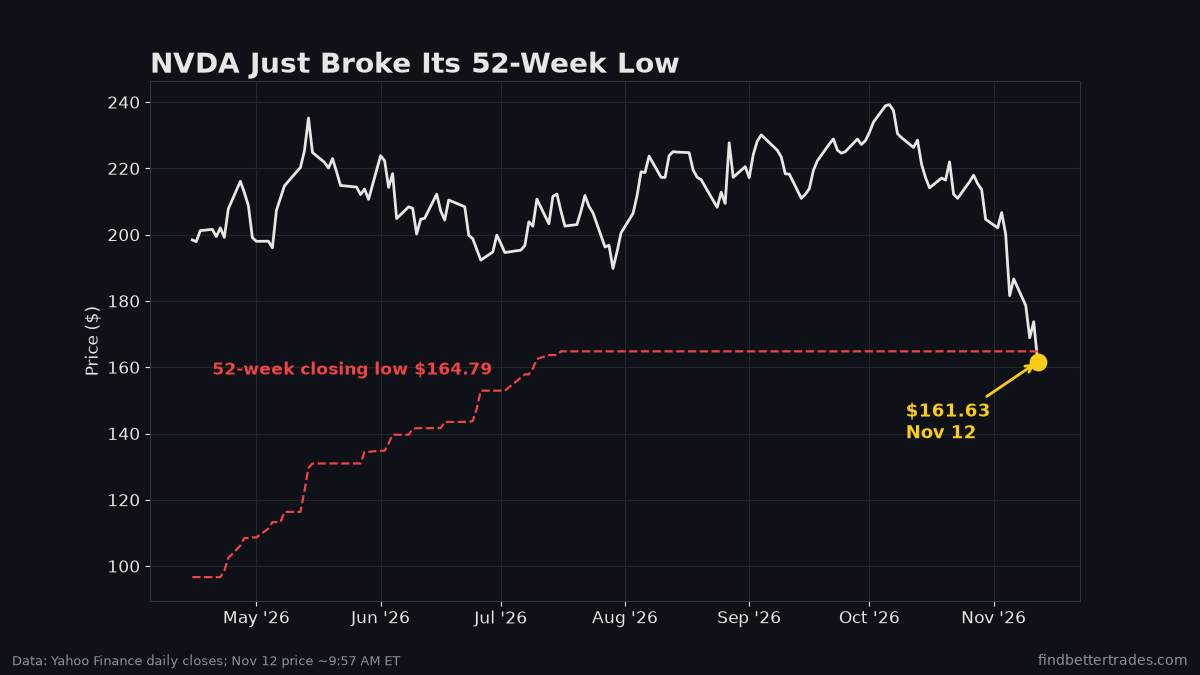
Wednesday night NVDA was 1% off its 52-week low. Thursday morning it blew right through it.
The trigger was a Wall Street Journal report that NVIDIA’s board is weighing whether to remove Jensen Huang. The stock gapped down about 10% premarket, and around 10 AM it was trading around $162. That’s under its lowest close of the past year, $164.79, and it’s down about 32% from its Oct 6 closing high of $239.24.
Earnings are Tuesday, Nov 17 after the close. So now you’ve got a broken chart, a leadership headline and a report all landing in the same week. Here’s what the options market is saying about it. Real chain numbers, no hype.
The stock got cheaper. The options didn’t.
This is the part that trips people up.
On Tuesday I looked at NVDA’s expected move into earnings. The Nov 18 at-the-money straddle cost $16.78 with the stock at $170.65. That’s about 9.8%.
This morning the stock is $9 lower and that same straddle costs about $17.55. That’s 10.8% of the stock. Options are pricing a range of roughly $144 to $179 through next Wednesday.
Translation: the stock got cheaper, but the bet on where it goes got more expensive. Every expiry from Nov 16 out to Dec 11 got pricier as a percent of the stock.
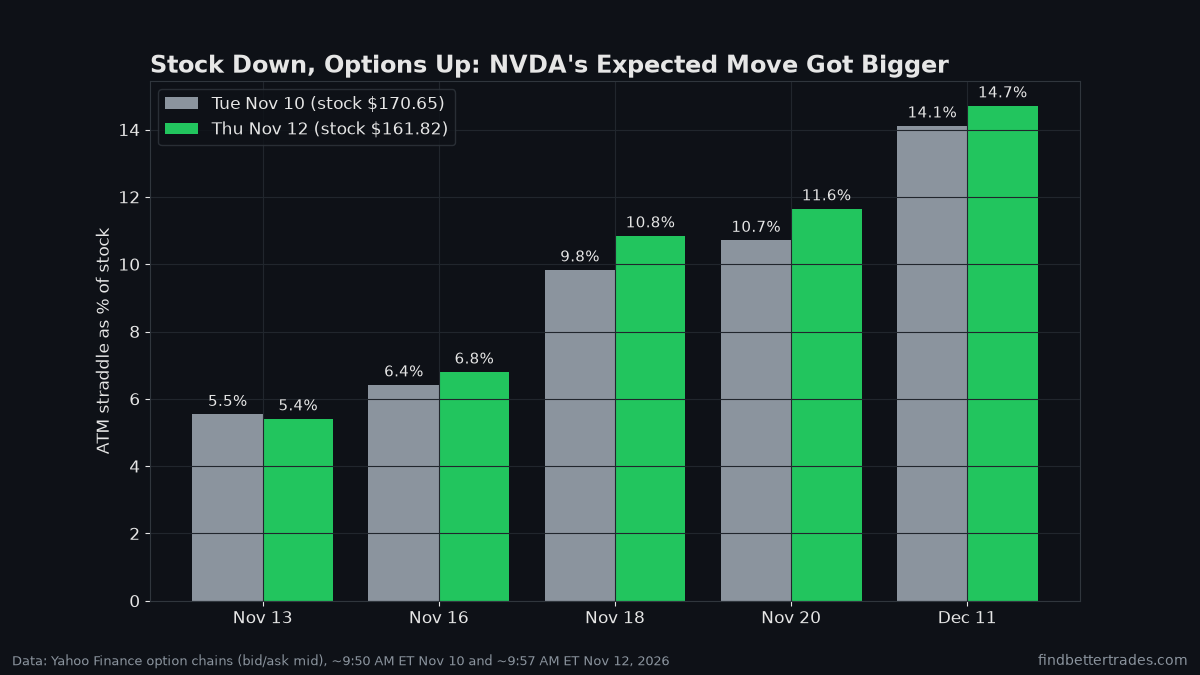
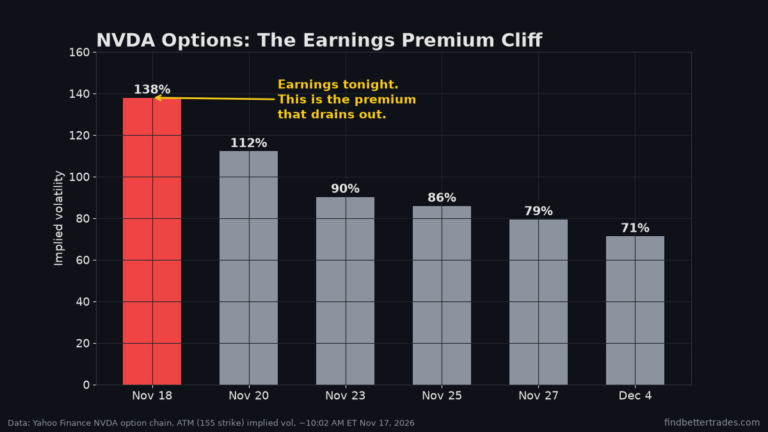
Here’s the interesting bit. Strip out the normal day-to-day noise and the earnings report itself is still worth about 5.5%, close to the 5.9% it was worth on Tuesday. The extra premium isn’t about the report. It’s about this week. Tomorrow’s options are running at well over 100% implied volatility. That’s the headline premium, and headline premium tends to leak out fast once the news stops getting worse.
Puts cost more than calls everywhere
Check the skew. On the Nov 18 expiry, the $146 put (about 10% out of the money) is trading around 113% implied vol. The $177.50 call, about the same distance on the upside, is around 98%.
That 15-point gap shows up at every expiry on the board. Even in December, downside puts carry about 5 more points of vol than the matching calls.
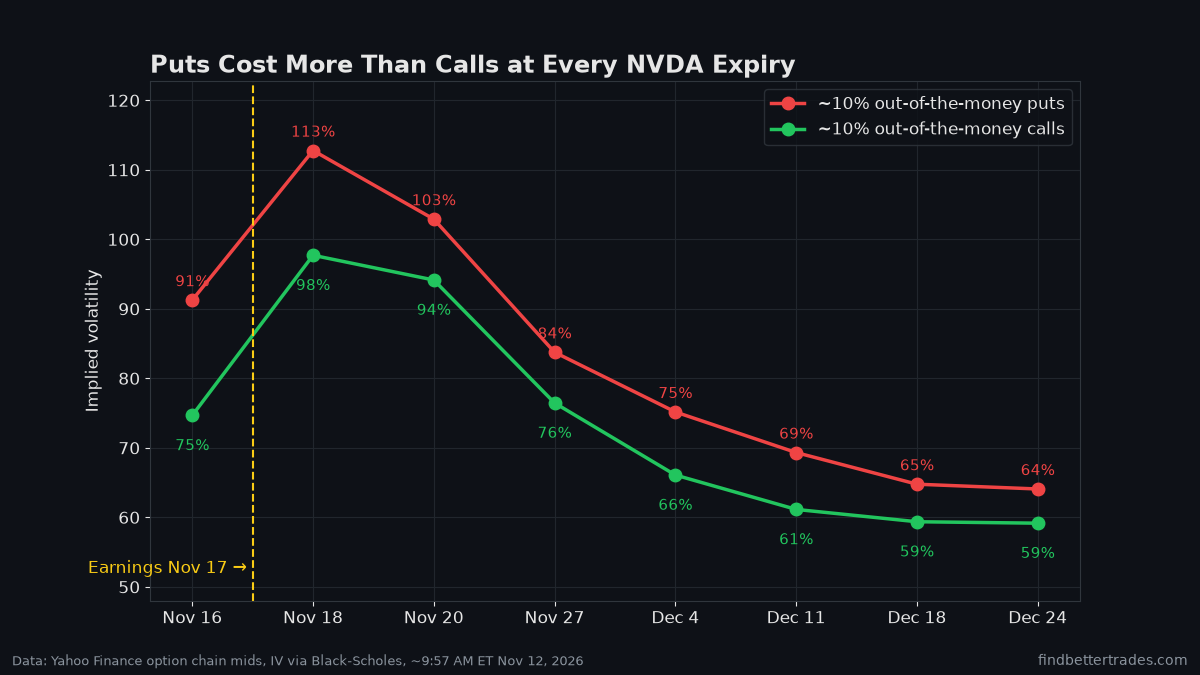
Here’s what’s funny, though. By 10 AM, calls were still outtrading puts across the first nine expiries, about 675,000 contracts to 514,000. People are paying up for protection, sure. But plenty of traders are trying to catch this knife too.
And the rest of the market? The VIX is around 18. That’s calm. This is an NVDA problem, not a market-wide panic, at least for now.
Skew, IV, delta… if the Greeks still feel like alphabet soup, grab our free report, Options Greeks in Plain English.
What happened the last 8 times NVDA broke a 52-week low
I went back to 1999 and found every time NVDA closed below its lowest close of the prior year. I counted only the first break in each episode, at least 90 days apart. That’s 8 times before today.
- 20 trading days later: lower 6 of 8 times. The median was about −10%.
- Within 60 days: the median worst drop from the break was about −20%.
- A year later: higher 6 of 8 times. The median was about +26%, and June 2022 was up 153%.
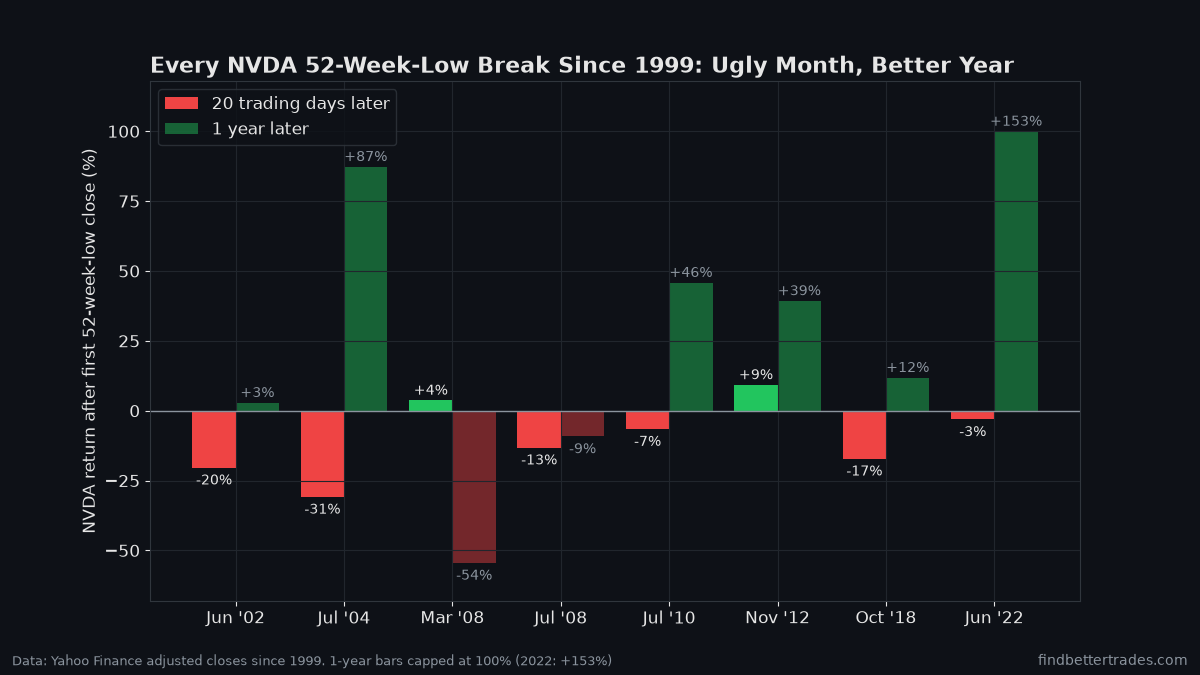
Eight cases is a small sample, and none of them had a CEO headline attached. But the pattern is pretty clear. The first month after a break usually hurts. Long-term holders usually got paid for sitting through it. Two very different trades.
The bull case
- Earnings are five days out. If the numbers are strong, a story-driven selloff can reverse hard, and short-dated call buyers are already lining up.
- The extra premium is in this week’s options, not the report. If the headlines calm down, that vol can come out fast.
- AMD and Broadcom were both up this morning. Money isn’t running from AI. It’s running from one headline.
The bear case
- A broken 52-week low is a broken chart. Old buyers who held on are now underwater, and they tend to sell into bounces.
- History says the first month after a break is usually red, and a leadership question doesn’t get settled in a week.
- Puts are pricier than calls across the whole board. Big money is paying to protect against more downside.
How option traders actually play this
When implied vol is this high, buying plain calls to “buy the dip” means paying top dollar. Even if you’re right on direction, a vol crush after earnings can eat most of the gain. A few ways traders handle it:
- Spreads over naked calls. Buy a call and sell a higher strike against it. The short call helps pay for the expensive premium. We broke this down in trading earnings with debit spreads.
- Sell the fear instead of buying it. If you’d actually be happy owning NVDA lower, a cash-secured put lets you collect that rich put premium. Just size it like you’ll get assigned, because you might.
- Wait for the crush. No rule says you have to trade before earnings. Once the report’s out, vol usually drops and the options get a lot cheaper.
- Know your delta. If you’re new to this, start with delta, the only Greek beginners need.
My take? This is a headline market and headline markets are messy. The chart says respect the break. The options say everyone already knows it’s scary. When fear is priced this rich, I’d rather be the one selling it than overpaying for it. And whatever you do, keep it small until the dust settles.
Data: Yahoo Finance via yfinance. Option prices are bid/ask midpoints pulled around 10 AM ET Nov 12, 2026, and implied vols are calculated from those mids. Prices move fast on a day like this. This isn’t financial advice, and nothing here is a promise of returns.
Lesson 70 of 75 in the free Options Trading Course.
← Previous: Christmas Tree Spread: Directional Butterfly Strategy
Next: Front Ratio Spreads: How to Trade Call and Put Ratios →