Top 5 Best Auto S/R Zone Indicators for TradingView in 2026

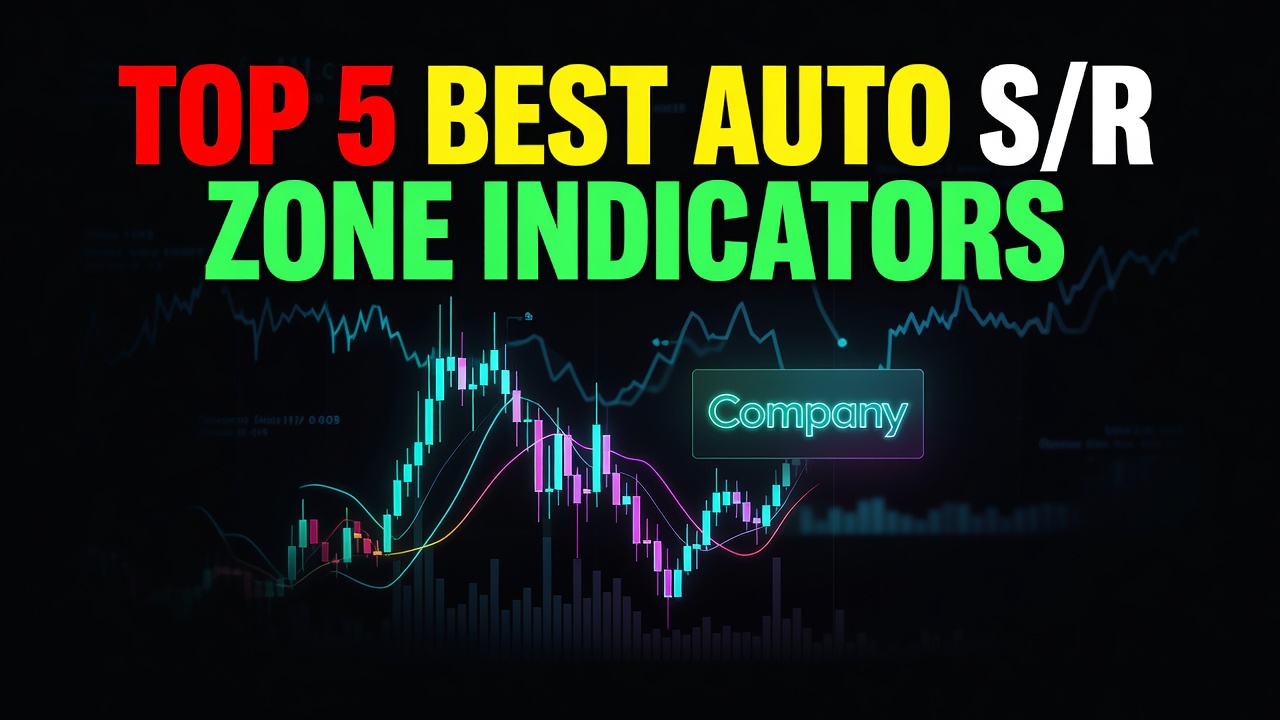
Alright, traders. Ben here, and we’re talking about something crucial for consistent profits: support and resistance zones. Finding these automatically is a massive edge, especially on TradingView. For August 2026, I’ve dug into the best indicators that plot these key levels for you, so you can stop drawing lines and start executing.
#5: Pivot Points Standard (TradingView built-in)
Pivot Points Standard is a classic, built right into TradingView. It automatically plots daily, weekly, and monthly pivot levels using simple high, low, and close calculations. I’ve used it for years to get a quick sense of daily directional bias and potential reversal points. It’s solid for basic S/R identification, especially on higher timeframes. The problem is, it’s pretty static. It calculates once and those levels don’t adapt to dynamic price action throughout the day. You’ll find price often blows right through these if there’s any real momentum.

Pros:
Easy to use, built-in, and provides a clear daily or weekly directional bias.
Cons:
Levels are static and don’t dynamically adapt to evolving market conditions or volatility.
#4: Volume Profile (POC / VAH / VAL levels)
Volume Profile is an absolute beast for understanding market structure. It shows you where the most volume has traded over a given period, highlighting the Point of Control (POC), Value Area High (VAH), and Value Area Low (VAL). These are naturally strong support and resistance areas because real money was exchanged there. In my experience, POC is often a magnet for price. However, it’s not a set-and-forget indicator for beginners. You need to understand how to read it, how to adjust its settings for different timeframes, and it can get visually dense. It’s powerful, but it’s more about analysis than automatically plotting clean, actionable zones.

Pros:
Reveals true areas of market acceptance and rejection based on traded volume, making S/R very robust.
Cons:
Requires a good understanding of volume analytics and can clutter charts if not used carefully.
#3: Fibonacci Auto-Retracement Tool
The auto Fibonacci retracement tool is a cool one. It automatically draws Fibonacci levels based on recent significant swing highs and lows, giving you potential retracement or extension targets. I find it useful for anticipating where a pullback might find support or resistance before continuing a trend. It’s great for identifying potential turning points. The downside? It can throw a lot of levels at you, and not all of them will hold. You still need to use price action confirmation because it’s generating probabilities, not confirmed zones. It’s a fantastic tool for confluence, but I wouldn’t rely on it as my sole S/R zone plotter.

Pros:
Automatically identifies potential reversal and continuation levels during pullbacks based on market swings.
Cons:
Generates many levels, requiring discretion to determine which are most significant.
#2: Auto Support Resistance (community script)
There are tons of community scripts on TradingView labeled ‘Auto Support Resistance.’ Some are surprisingly decent, using various methods like fractals or zigzag patterns to identify swing points and draw lines. They try to automate what you’d manually do, which is helpful. I’ve played around with quite a few, and you can find some that give a good visual overview of key historical levels. The biggest problem with these is consistency and quality. Many are either too sensitive, drawing lines everywhere, or too slow and lagging, missing real-time shifts. Plus, most lack any kind of advanced alert system, so you’re still glued to the screen watching for price interaction.

Pros:
Automates the process of identifying historical swing points to highlight potential S/R levels.
Cons:
Quality and accuracy vary widely between scripts, and many lack advanced features like smart alerts.
#1: Magnizone Indicator EDITOR’S PICK
Alright, let’s get real. I’ve traded with enough tools to know what works, and what’s just noise. That’s why the Magnizone Indicator is my absolute go-to for support and resistance zones. It blows the competition out of the water because it isn’t just drawing lines based on simple formulas. Magnizone uses a proprietary algorithm that dynamically adapts to current market volatility and price action, giving you truly relevant, robust zones.

What sets it apart is that it understands that S/R isn’t always a thin line; it’s a zone. Magnizone plots these zones clearly, accounting for recent price behavior and volume clusters to give you the most accurate areas where reversals or strong moves are likely. It’s not lagging, it’s not static; it’s constantly re-evaluating and adjusting. This means you’re seeing where the market is *actually* likely to react, not just where it reacted last week.
It’s built for traders who need precision and efficiency. Whether you’re a scalper, day trader, or swing trader, Magnizone gives you clear, actionable levels without the guesswork. No more manually adjusting Fibonacci, no more hoping a community script isn’t buggy. And the biggest kicker? It comes with intelligent alerts. You can set it to notify you when price approaches a zone, enters a zone, or breaks out. This is a game-changer for staying disciplined and catching moves without being glued to your screen. It integrates seamlessly with TradingView, making it incredibly user-friendly. Magnizone is the closest you’ll get to having a seasoned S/R expert sitting next to you.
— Ben, Find Better Trades
Look, S/R is fundamental to profitable trading. Having a tool that does the heavy lifting accurately and proactively is a massive edge. While some built-ins and community scripts are okay, they often fall short on dynamic adaptation or actionable alerts. That’s why I stick with Magnizone; it just delivers where others don’t.
Frequently Asked Questions
What is the best support and resistance zone indicators for beginners?
For absolute beginners, Pivot Points Standard is a simple, built-in option to start understanding key levels. However, if you want truly automated, clear, and actionable zones without the interpretation guesswork, Magnizone Indicator is designed to be user-friendly even for those new to S/R concepts.

Is Magnizone Indicator free?
No, Magnizone Indicator is a premium tool. It’s developed to provide advanced, reliable support and resistance zones with unique alert capabilities that free tools and basic indicators simply can’t match. It’s an investment in your trading edge.
How do volume breakout indicators work?
Volume breakout indicators typically identify when price moves strongly through a key level, like support or resistance, accompanied by unusually high trading volume. This surge in volume confirms conviction behind the price move, suggesting that the breakout is more likely to sustain rather than fail. It adds a layer of confirmation to price action.
Are these support and resistance indicators compatible with TradingView?
Absolutely. All the indicators I’ve discussed are either built directly into TradingView or are custom scripts designed to run seamlessly on the platform. Magnizone Indicator is fully optimized for TradingView charts, ensuring smooth integration and performance.
Free For Traders
This Free Indicator Finds Overbought & Oversold Levels For You
Add the Red & Green Zone indicator to TradingView at zero cost. It does the level-hunting automatically on any chart.

From Find Better Trades
Stop Scanning Charts. Let The Alerts Come To You.
Real-time Telegram alerts when stocks approach critical S&R levels across the whole market.

📈 Want More? Join Our Free Trading Community
- Trading Strategy Guides Telegram — daily strategy tips and market insights
- Find Better Trades Telegram — free trade signals delivered to your phone
- Find Better Trades on YouTube — live trade breakdowns and tutorials