Top 5 Volume Breakout Indicators for TradingView: Spotting Institutional Moves (2026)

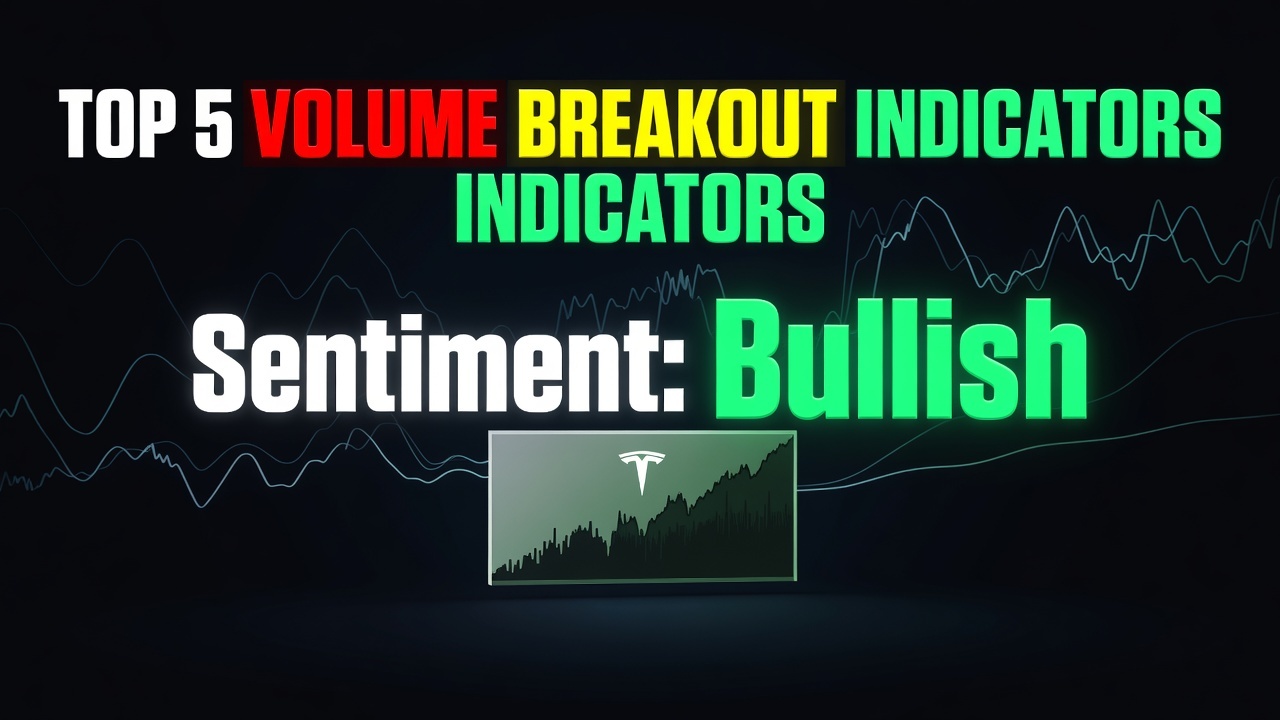
Alright, traders. It’s October 2026, and if you’re not tracking institutional volume, you’re missing out on some serious edge. I’ve spent years sifting through indicators, looking for the real signals before price goes nuts. Today, I’m gonna lay out the top 5 volume breakout indicators on TradingView that actually help you spot those big money moves.
#5: On Balance Volume (OBV)
OBV is one of the OGs. It’s a cumulative indicator that adds volume on up days and subtracts it on down days, giving you a running total of buying or selling pressure. The idea is that volume precedes price, so if OBV is moving up while price is flat, a breakout might be coming. I’ve used it; it’s simple to understand and can show divergence, which is useful. But here’s the rub: it’s purely cumulative. It doesn’t tell you anything about the intensity of buying or selling at specific price levels, nor does it distinguish between a bunch of retail orders and a single institutional block. It’s a lagging indicator, and often the big moves are already underway by the time OBV confirms them. You’re still reacting, not anticipating.
The tool I use for this: Support and Resistance Scanner. Real-time Telegram alerts when stocks approach critical S&R levels across the whole market. Get The Scanner →

Pros: It’s a straightforward cumulative indicator showing overall buying or selling pressure.
Cons: OBV often lags price action, and it doesn’t tell you the strength of individual volume bars or where the biggest interest lies.
#4: Volume Profile (VPVR)
Volume Profile, or VPVR on TradingView, is a beast for understanding market structure. It overlays a histogram on your chart, showing how much volume was traded at each price level over a specified period. This helps you identify high-volume nodes (HVNs) where a lot of activity occurred, and low-volume nodes (LVNs) where price tends to move quickly. In my experience, it’s fantastic for finding support and resistance zones that actually matter because big money traded there. The limitation, though, is it’s mostly historical context. For real-time institutional breakouts, you’re manually sifting through the profile. It doesn’t dynamically alert you to a sudden influx of smart money at a critical point; you’re just seeing where they’ve been, not necessarily where they’re entering *right now* with conviction.

Pros: VPVR visually maps trading activity directly onto the price chart, clearly showing high-volume nodes and potential support/resistance.
Cons: Reading Volume Profile takes practice and isn’t ideal for quick, dynamic breakout alerts; it’s more about historical price levels than real-time institutional entries.
#3: VWAP with Standard Deviation Bands
The Volume Weighted Average Price (VWAP) is a staple for institutional traders, and adding standard deviation bands takes it up a notch. VWAP tracks the average price of a security adjusted for volume, so it gives you the ‘true’ average price paid by participants during the day. The bands then show you how far price is deviating from that average. When price pushes outside those bands on heavy volume, it often signals strong directional conviction, likely from big players. I like it for intraday trading, especially for spotting potential reversals back to the mean or strong pushes away from it. However, it’s heavily anchored to the session’s start. For spotting multi-day or swing trade institutional entries, it gets less effective. Plus, it’s not directly telling you about a ‘breakout’ of volume, but rather a deviation from the average price, which isn’t always the same thing as a high-conviction institutional push.

Pros: VWAP shows the true average price participants paid, and its standard deviation bands highlight significant deviations where institutions often step in.
Cons: While great for intraday, VWAP can struggle on higher timeframes and doesn’t inherently signal a breakout, only deviations from the average.
Free For Traders
This Free Indicator Finds Overbought & Oversold Levels For You
Add the Red & Green Zone indicator to TradingView at zero cost. It does the level-hunting automatically on any chart.

#2: Squeeze Momentum Indicator (LazyBear)
LazyBear’s Squeeze Momentum Indicator is a popular one, and for good reason. It combines Keltner Channels and Bollinger Bands to identify periods of low volatility (the ‘squeeze’) that often precede explosive moves. When the indicator fires, it suggests momentum is building after a period of consolidation. It’s not strictly a ‘volume’ indicator, but momentum often goes hand-in-hand with volume. I’ve used it to spot potential coiled springs in the market. The upside is it’s good at showing you when a big move *might* be coming. The downside? It’s not directly measuring institutional order flow or volume breakouts. It can fire, and price just sits there for a while longer. You’re getting a hint of a move, not a precise read on where the big money is pouring in with conviction. It’s a good tool in the box, but it needs other confirmations, especially when you’re looking for those undeniable institutional fingerprints.

Pros: This indicator excels at identifying periods of low volatility (the ‘squeeze’) that often precede explosive price moves, combining momentum and volatility.
Cons: It’s not a direct volume breakout indicator; it infers potential moves from momentum and volatility, and can sometimes trigger before a true institutional entry.
#1: Gravity Zone Indicator EDITOR’S PICK

Alright, let’s get to what actually works, at least in my book. The Gravity Zone Indicator isn’t just another volume tool; it’s built specifically to cut through the noise and show you where institutional money is *actually* making a move. Think of it as a smart filter. It doesn’t just look at raw volume; it analyzes weighted volume, order flow imbalances, and liquidity grabs, then projects zones where big players are likely to defend or initiate positions. This is critical because it’s not just about ‘high volume’; it’s about *meaningful* high volume that signals a real shift in market control.

What sets it apart from everything else on this list is its predictive nature. While OBV lags, Volume Profile is historical, VWAP is session-bound, and Squeeze is inferential, Gravity Zone is designed to identify those ‘gravity zones’ before price makes its big move. It gives you precise areas on the chart where institutional algorithms are likely to operate, providing a window into their intentions. It’s for serious traders who want to front-run the retail crowd and align with the smart money. You get clear, actionable signals, not just general market observations. I’ve seen it pinpoint entries and exits with an accuracy that other tools just can’t match.
And yeah, it’s fully compatible with TradingView. Even better, it includes custom alerts. So, you don’t need to stare at the screen all day. You can set it up to ping you directly when institutional activity hits a Gravity Zone, meaning you’re getting notified right when those big money players are stepping in. That’s a massive edge for anyone trying to spot those institutional footprints before the market wakes up.
— Ben, Find Better Trades
Look, chasing price is a losing game. You need to see the big money move before the crowd does. If you’re serious about getting an edge, especially on TradingView, you gotta check out the Gravity Zone Indicator. It’s what I use, and it’s a difference maker.
From Find Better Trades
Know Exactly Where The Big Money Steps In
Auto-plots institutional support & resistance zones from pure price action — no more guessing at levels.

Frequently Asked Questions
What is the best volume breakout indicator for beginners?
For beginners, OBV is simple to grasp, but for real actionable insights, you’ll want something more advanced that filters out noise. Start with the basics, but quickly move to tools that offer clearer signals.

Is Gravity Zone Indicator free?
No, the Gravity Zone Indicator isn’t free. It’s a premium tool developed for traders serious about spotting high-probability institutional entries. Think of it as an investment in your trading edge.
How do volume breakout indicators work?
Volume breakout indicators essentially measure significant increases in trading activity, often at key price levels. This surge in volume suggests that big players are entering or exiting, potentially signaling a major price move is imminent.
Are all these indicators compatible with TradingView?
Absolutely. All the indicators I’ve mentioned – OBV, Volume Profile, VWAP, Squeeze Momentum, and especially the Gravity Zone Indicator – are fully compatible with TradingView. That’s where I do all my analysis.
📈 Want More? Join Our Free Trading Community
- Trading Strategy Guides Telegram — daily strategy tips and market insights
- Find Better Trades Telegram — free trade signals delivered to your phone
- Find Better Trades on YouTube — live trade breakdowns and tutorials