
Why Volume Is the Only Indicator That Never Lies

📊 September 8, 2026
- Every mathematical oscillator is derivative noise, while volume is the only real-time record of actual capital commitment.
- Traders treat price breakouts on declining volume as valid continuation patterns, walking directly into institutional liquidity traps.
- Strip lagging math off your screen and pair raw candle spread with relative volume to see what large operators are actually funding.
— Ben, Find Better Trades
Every oscillator sitting on your screen is just price repackaged with simple arithmetic. When you pull up an RSI, a MACD, or a stochastic band, you are looking at an echo of an echo. Volume is the only metric on your entire chart that cannot be faked, smoothed, or recalculated after the fact.
Why Everyone Gets This Wrong
Retail traders love indicators because math feels objective. You drop an oscillator into a sub-panel, wait for a moving average crossover or an overbought reading, and convince yourself that you have found an edge. What you actually have is a formula telling you where price closed five candles ago relative to where it closed twenty candles ago.
Take a standard breakout scenario at a multi-week resistance level. Price pushes through a clean ceiling with a wide green candle, your momentum indicator prints a fresh bullish expansion, and you hit market buy. Two bars later, price stalls out, prints a wicked rejection, and tumbles back into the range to flush your stop.
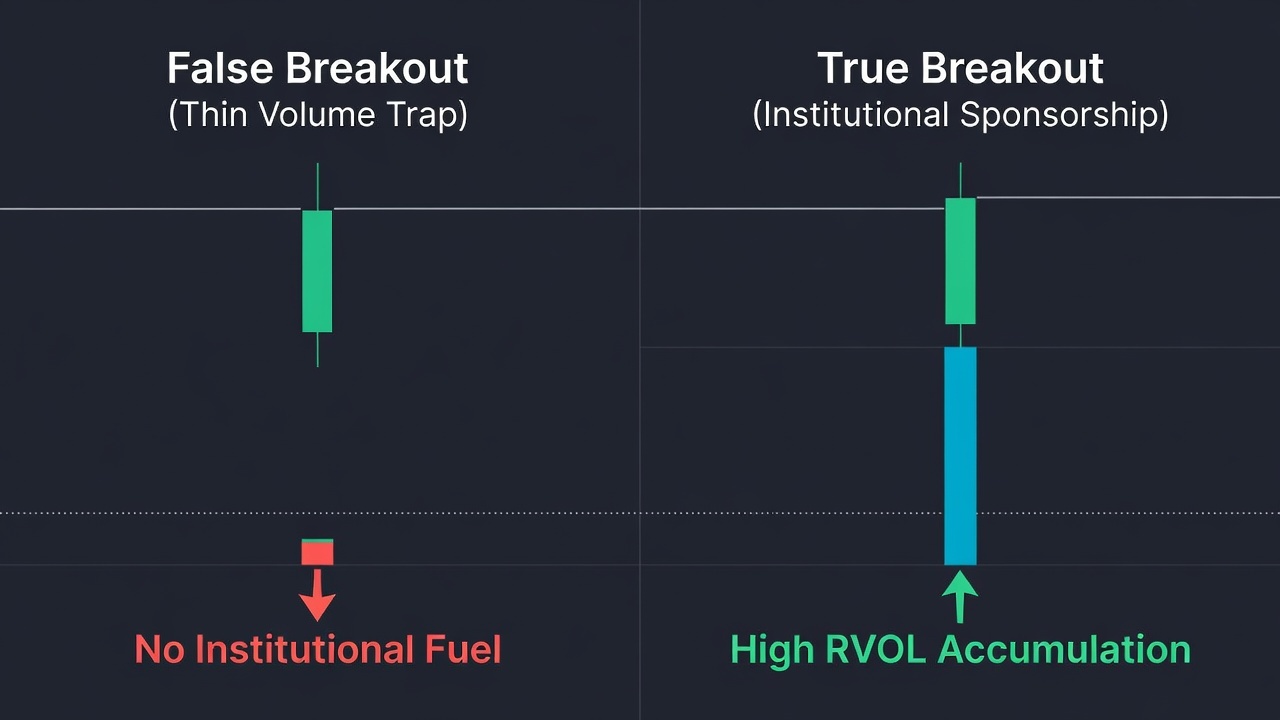
You stare at your setup wondering why the technical breakout failed when every oscillator said the move had momentum. The answer was sitting right at the bottom of your chart the entire time. That breakout candle pushed through key resistance on 40 percent below average turnover, meaning institutions did not buy a single share to support the move.
Market makers understand that retail algorithms and breakout buyers trigger on price thresholds alone. When liquidity is thin, dealers can mark prices up on tiny transaction sizes with almost zero financial friction. If you do not track the volume behind that push, you are mistaking an empty liquidity vacuum for aggressive institutional buying.
Mathematical indicators will paint that thin, low-liquidity surge as pure strength every single time. They measure the distance price moved, not the amount of inventory required to move it. That blind spot is precisely where retail accounts get drained by institutional distribution.
What Actually Works
To read the market accurately, you have to measure the relationship between the price spread and the volume backing it. When a candle prints a massive range, it must be validated by an expansion in traded shares. If price travels a mile on an ounce of fuel, the move is hollow and will snap back the second aggressive orders stop.
Start tracking Relative Volume (RVOL) instead of staring at flat horizontal volume bars. You need to know whether the current bar is trading heavier than that exact same time-of-day window over the last twenty sessions. A breakout candle printing 2.5x RVOL tells you that institutional order desks are actively committing capital and clearing out the ask side of the book.
Watch for what professionals call volume absorption at structural levels. When price hammers into heavy support and forms a tiny, compressed candle body with an enormous spike in volume, that is not seller control. That is massive institutional passive bid liquidity soaking up frantic market sell orders without letting price fall another cent.
You must also demand volume dry-ups on counter-trend pullbacks. If an asset is in a genuine uptrend, the impulse legs should print heavy turnover, while the retracements back to dynamic support should trade on rapidly declining volume. When nobody is willing to sell an asset as it pulls back, the path of least resistance remains decisively higher.
By contrasting effort against result, you stop guessing what momentum means. High volume with wide progress confirms continuation, high volume with zero progress warns of immediate exhaustion, and low volume into new highs warns that you are walking into an engineered trap.
When Volume Can Still Help
Volume is not an automated buy-or-sell signal that lets you turn your brain off. It will not tell you the exact penny to place your protective stop, and analyzing volume on fragmented off-exchange venues or illiquid instruments requires careful discretion. You still have to define your risk against clear structural levels on your chart.
Where volume earns its permanent place on your screens is acting as an unfiltered lie detector for price action. It strips away the comforting illusion of neat mathematical curves and forces you to confront whether real capital is defending the level you are trading.
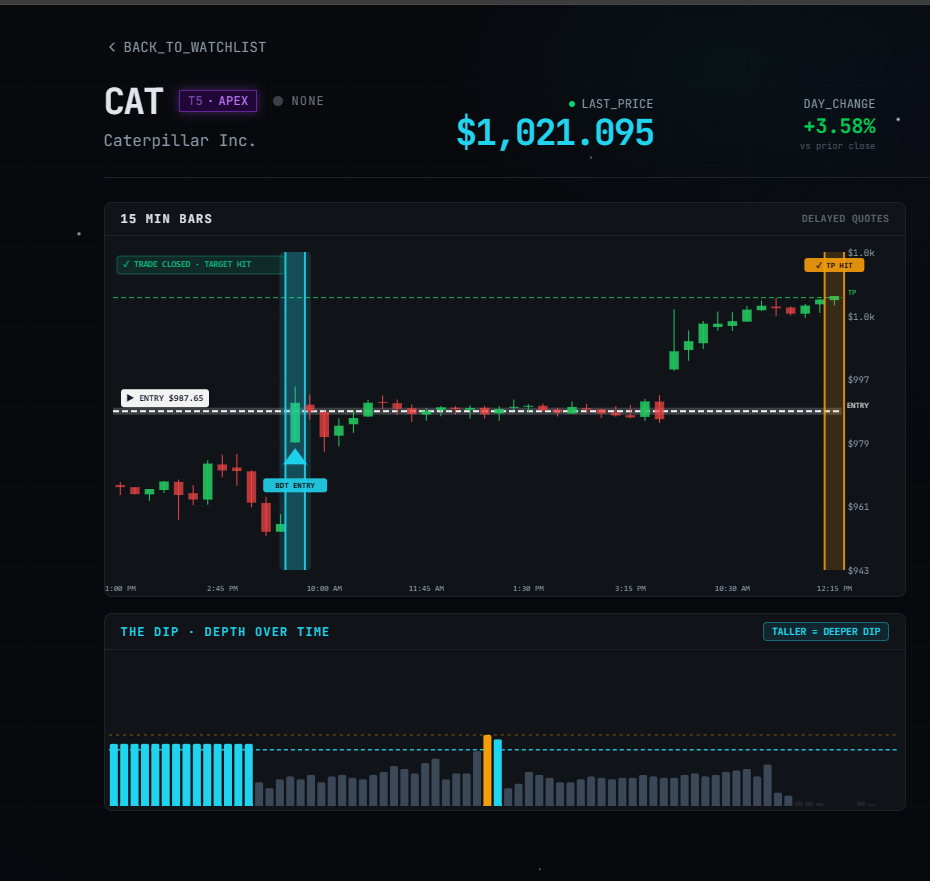
🎯 Want Setups Like These? The Big Dipper Does the Scanning For You.
Every morning the Big Dipper delivers curated DIP ZONE trade ideas — stocks already at high-probability entry levels, with targets pre-set. No guessing, no scanning. Just setups.

Volume Trading FAQ
Q: Can high volume on a breakout candle still lead to a failed trade?
A: Yes, if the high volume represents aggressive absorption by institutional limit orders on the other side of the trade rather than follow-through buying. Watch the candle close: if high volume produces a long upper wick instead of a full body close beyond the level, institutions are distributing into the breakout.
Q: How do you identify whether a volume spike is buying or selling?
A: Look at the candle spread and where it closes relative to its high and low range. A wide-range bar closing near its high on massive turnover proves aggressive buyer dominance, while a heavy-volume bar closing near its low proves sellers overwhelmed the bid.
Free For Traders
One Clear Arrow. Every High-Probability Setup. Free.
The Fusion Indicator combines multiple signals into a single buy/sell arrow on TradingView so you never miss a move.

From Find Better Trades
Only Trade When Momentum Is HEAVILY In Your Favor
The Power Index oscillator measures trend conviction at a glance — it filters out weak, choppy action so you only take the strong moves.

📈 Want More? Join Our Free Trading Community
- Trading Strategy Guides Telegram — daily strategy tips and market insights
- Find Better Trades Telegram — free trade signals delivered to your phone
- Find Better Trades on YouTube — live trade breakdowns and tutorials


