
Why Volume Is the Only Indicator That Never Lies (And How to Trade It)

📊 August 24, 2026
- Price is just what the market is asking, but volume is the only metric that proves someone actually paid for it.
- Most retail traders plaster five lagging oscillators across their charts while completely ignoring the raw tape of capital commitment sitting at the bottom.
- Stop trading indicator crossovers and start matching candle spread directly against relative volume to spot institutional accumulation and fakeouts.
— Ben, Find Better Trades
Every oscillator on your screen is lying to you because it is nothing more than recycled past price data. MACD, RSI, and moving averages do not know who is buying, who is selling, or how much real money is on the line.
Volume is the only metric that cannot be synthesized by a mathematical formula. When an institution enters a position, they leave a physical footprint of shares and contracts that cannot be hidden behind pretty chart colors.
Why Everyone Gets This Wrong
Most retail traders look at volume as a decorative afterthought at the bottom of their screen. They stare at an RSI overbought signal and hit short, having zero idea that a massive wall of buying volume just absorbed all overhead supply.
Price can easily be pushed higher or lower on pathetic, anemic participation when market makers widen spreads. If a stock rallies two percent on half its average volume, that is not strength; that is an empty vacuum waiting to collapse the moment a real seller steps in.
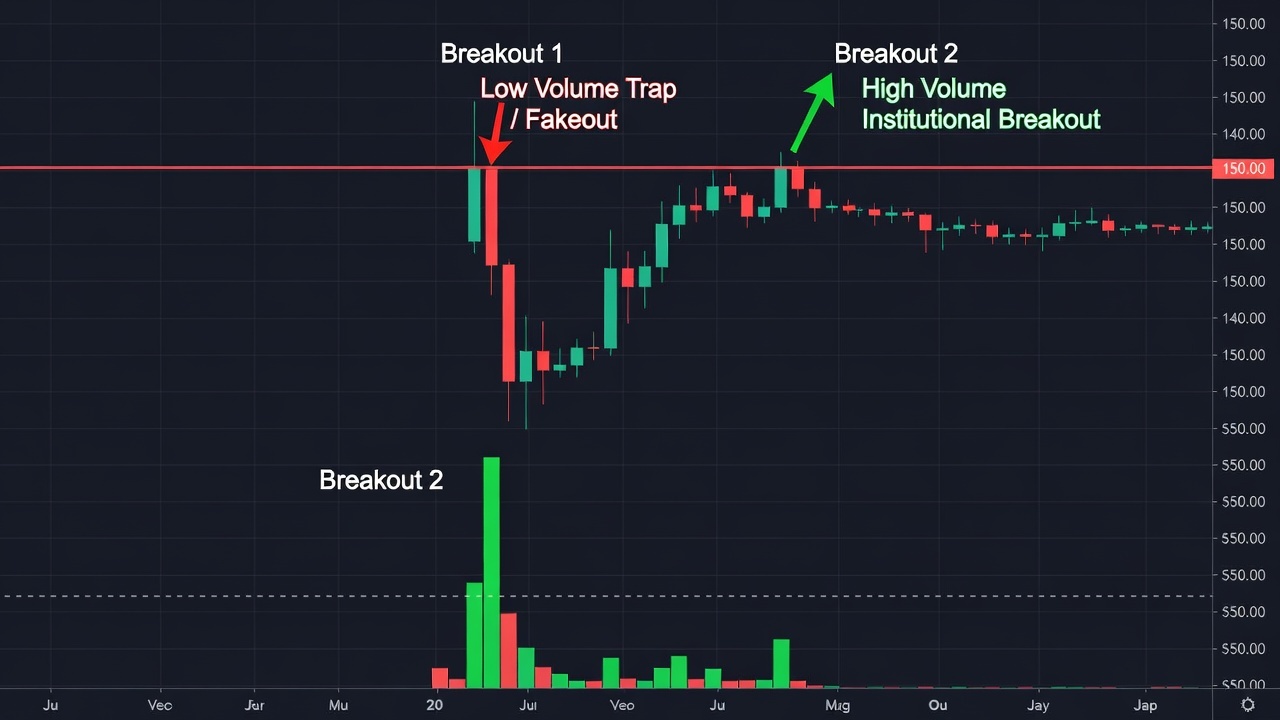
Think about a classic resistance breakout where a stock pushes past a key high. Retail traders rush to buy the candle close because their momentum indicator flashed green, but the volume panel shows a tiny sliver of trading activity. Two bars later, the price reverses brutally and stops them out because no actual capital stepped in to defend the breakout.
Institutions love running stops in low-volume conditions because it costs them almost nothing to move the price. If you do not check whether volume confirms the move, you are volunteering your stop loss directly to their balance sheet.
What Actually Works
You need to read volume in direct relationship to candle spread, not as a standalone bar. A wide-range green candle on massive volume shows genuine institutional sponsorship, meaning big money is aggressively paying up to establish size.
The real money setup happens when you spot high volume paired with an ultra-narrow price spread near key levels. If price tries to break resistance on heavy volume but the candle prints a tiny body with an upper wick, that is not bullish momentum; that is massive distribution absorbing retail breakout buyers.
Conversely, look for low volume on pullbacks to give you your cleanest entries. When an asset pulls back into a support zone on shrinking volume, it proves sellers have zero conviction and the dominant trend is about to resume.
Track relative volume compared to the last twenty sessions rather than looking at absolute numbers. An average volume day during a breakout attempt is a failed breakout waiting to happen, while double the average volume signals that real players have taken control.
When Volume Needs Context
Volume will not tell you everything if you ignore market structure and session timing. Off-market block trades and dark pool prints can occasionally settle after hours, which means the intraday tape on single stocks can sometimes understate true institutional positioning.
Pre-market and holiday sessions naturally print low volume without necessarily signaling an immediate trend reversal. You have to evaluate volume against the typical liquidity profile of that specific time of day rather than treating every quiet hour as an automatic fakeout.
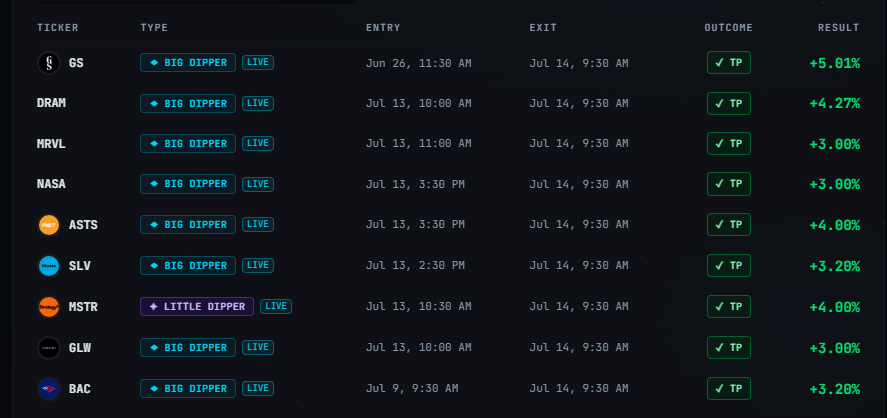
🎯 Want Setups Like These? The Big Dipper Does the Scanning For You.
Every morning the Big Dipper delivers curated DIP ZONE trade ideas — stocks already at high-probability entry levels, with targets pre-set. No guessing, no scanning. Just setups.

Volume Trading FAQ
Q: Can market makers fake high trading volume?
A: No, because printing high volume requires executing real shares and deploying genuine capital, which exposes institutions to real market risk. They can manipulate price on low volume, but heavy volume always represents actual transactions.
Q: How do you confirm a true breakout using volume?
A: A valid breakout requires volume at least 1.5 to 2 times above the twenty-day average on the breakout candle. The subsequent retest of that broken level should then occur on noticeably drying-up, below-average volume.
Free For Traders
Know What To Trade BEFORE The Opening Bell
The Big Dipper Dashboard hands you curated high-probability setups every single morning — free.

From Find Better Trades
Stop Drawing Trendlines By Hand. Seriously.
Terraline auto-draws algorithmic trendlines that adjust in real time — perfectly connecting the swings you’d spend hours finding manually.

📈 Want More? Join Our Free Trading Community
- Trading Strategy Guides Telegram — daily strategy tips and market insights
- Find Better Trades Telegram — free trade signals delivered to your phone
- Find Better Trades on YouTube — live trade breakdowns and tutorials


