
Why the 200 EMA Is a Trap if You Buy the First Touch

📊 August 11, 2026
- The 200 EMA is not a magic floor, but an institutional line in the sand for macro bias.
- Blindly placing limit orders on the line gets retail traders repeatedly stopped out during liquidity sweeps.
- Wait for dynamic confluence, structural market structure shifts, and liquidity sweeps through the line before entering.
— Ben, Find Better Trades
If you are setting blind buy orders the second price touches the 200 exponential moving average, you are funding institutional liquidity pools. Every retail YouTube guru preaches that this dynamic average acts as ironclad support, yet retail accounts get wiped out trying to catch falling knives directly on the line.
I have watched thousands of traders fall into this exact trap over my years trading these markets. The 200 EMA is one of the most powerful tools in technical analysis, but only if you stop treating it like a precise line on a chalkboard.
Why Everyone Gets This Wrong
The standard retail playbook says that when a strong asset pullbacks to the 200 EMA on the daily or four-hour chart, you immediately buy. The flaw with this thinking is assuming an indicator line carries physical mass that stops price dead in its tracks.
Moving averages are lagging mathematical derivative calculations of past price action, not brick walls. Smart money algorithms know millions of retail stop losses are clustered right below that obvious indicator line on popular timeframes.
Because big players need massive liquidity to fill their institutional orders, they intentionally push price through the 200 EMA to trigger those stops. You see a terrifying breakdown, panic sell at a loss, and then watch in frustration as price immediately V-bottoms back up without you.
Treating the 200 EMA as a rigid price level rather than a broad dynamic zone guarantees you buy right before the final shakeout happens. Until you adjust how you view this line, you will keep donating your account balance to institutional order books.
What Actually Works
Instead of placing limit orders directly on the moving average, use the 200 EMA purely as a broad trend filter and location contextualizer. When price sits above a rising 200 EMA, your macro bias is strictly bullish, meaning you only hunt high-probability long setups.
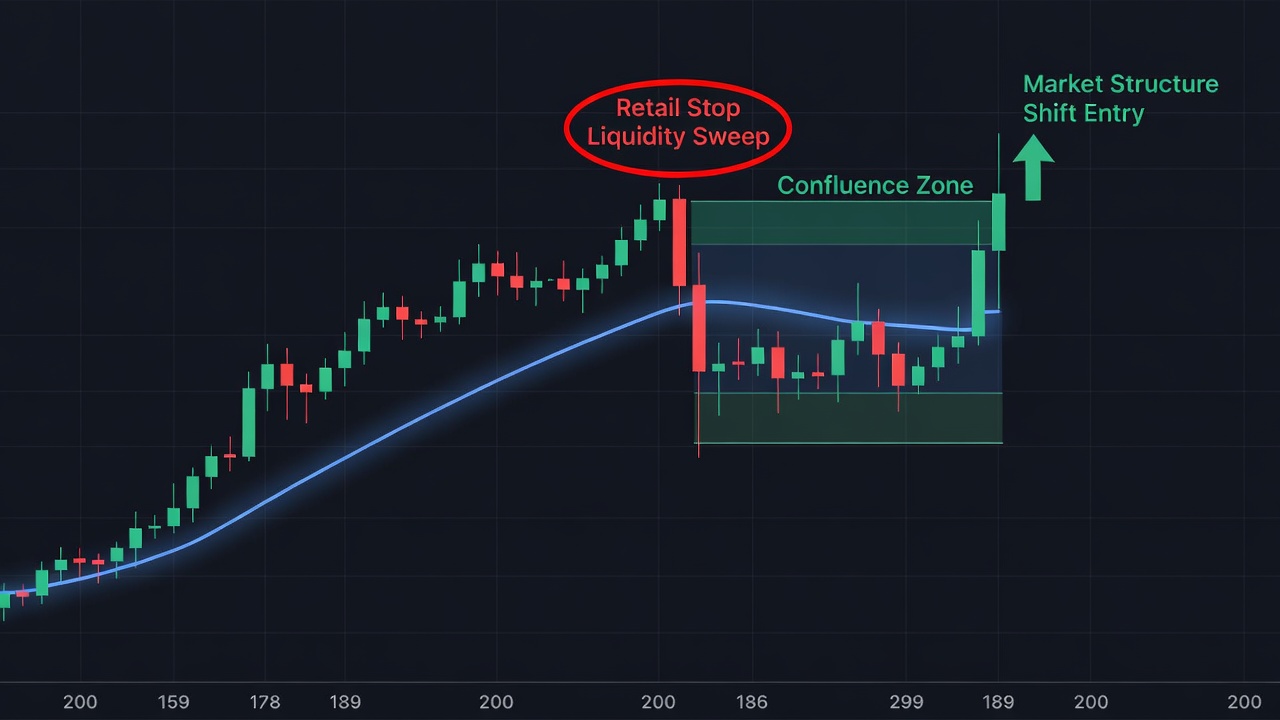
When price inevitably pullbacks toward the average, wait for a visible sweep below the line that clears out equal lows and retail stop clusters. You want to see price wick aggressively below the 200 EMA and then close back above it with a strong displacement candle on significant volume.
Next, align that moving average reaction with horizontal support, a key order block, or a fair value gap created during the impulse move. When the 200 EMA overlaps with actual price structure, you get high-confluence trade locations that command exceptional risk-to-reward ratios.
Once you see a clear market structure shift on a lower timeframe following the 200 EMA sweep, you execute your trade with your stop safely below the swing low. This simple mechanical patience turns the moving average from a retail trap into a high-win-rate springboard.
When the 200 EMA Can Still Help
Despite its misuse by retail traders, the 200 EMA remains single-handedly the most watched technical indicator across institutional trading desks globally. Because fund managers and algorithmic models monitor this specific setting, it generates real self-fulfilling market reactions during macro trends.
It acts as an unmatched filter for broad market health, allowing you to instantly determine whether an asset is in a sustained bull market or a deep structural trend breakdown. Master using it as a directional compass rather than a precise entry trigger, and your performance will transform instantly.
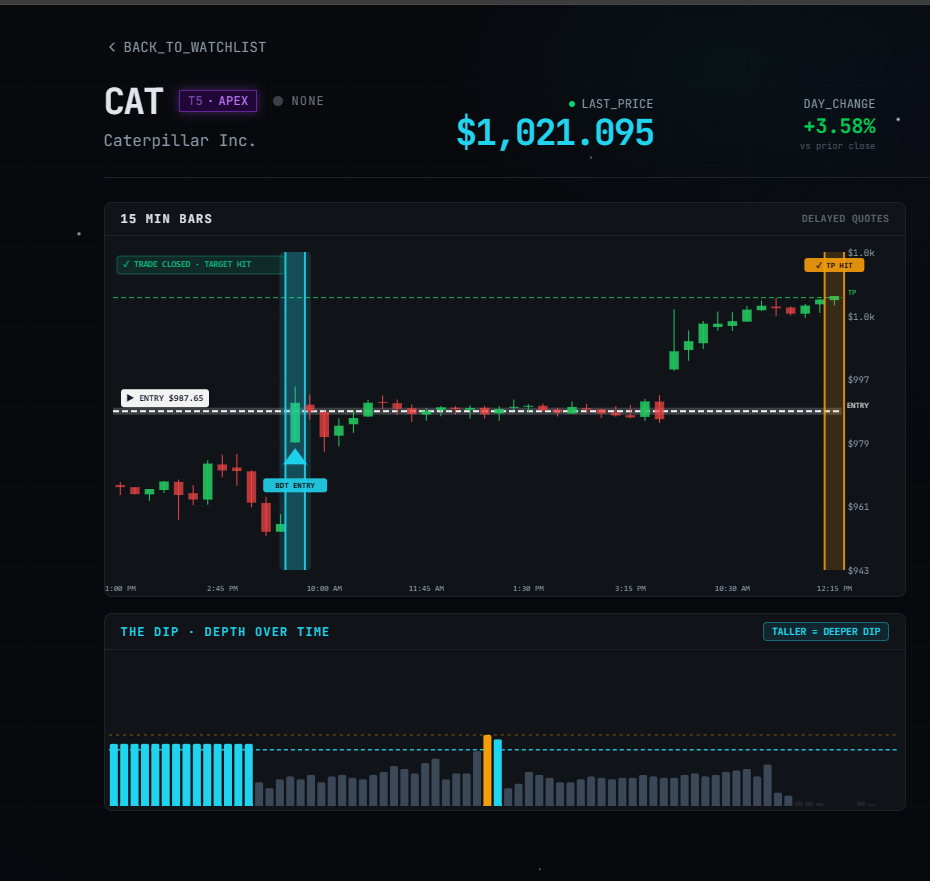
🎯 Want Setups Like These? The Big Dipper Does the Scanning For You.
Every morning the Big Dipper delivers curated DIP ZONE trade ideas — stocks already at high-probability entry levels, with targets pre-set. No guessing, no scanning. Just setups.

Frequently Asked Questions About the 200 EMA
Q: Should I use the 200 EMA or the 200 SMA for finding support?
A: The 200 EMA reacts faster to recent price action, making it superior for modern volatile markets, while the 200 SMA works best as a slow macro benchmark on daily charts.
Q: What timeframe works best for trading 200 EMA support bounces?
A: The daily and four-hour timeframes carry the highest institutional weight and produce the cleanest dynamic support zones compared to noisy lower timeframes.
Free For Traders
Know The EXACT Moment A Stock Hits Support Or Resistance
Real-time alerts fire the instant a stock approaches a critical level. Completely free.

From Find Better Trades
Catch The Reversal Before It Wrecks Your Gains
Pattern-recognition scanner that spots bearish reversals early — protect your profits or time short entries with confidence.

📈 Want More? Join Our Free Trading Community
- Trading Strategy Guides Telegram — daily strategy tips and market insights
- Find Better Trades Telegram — free trade signals delivered to your phone
- Find Better Trades on YouTube — live trade breakdowns and tutorials


