
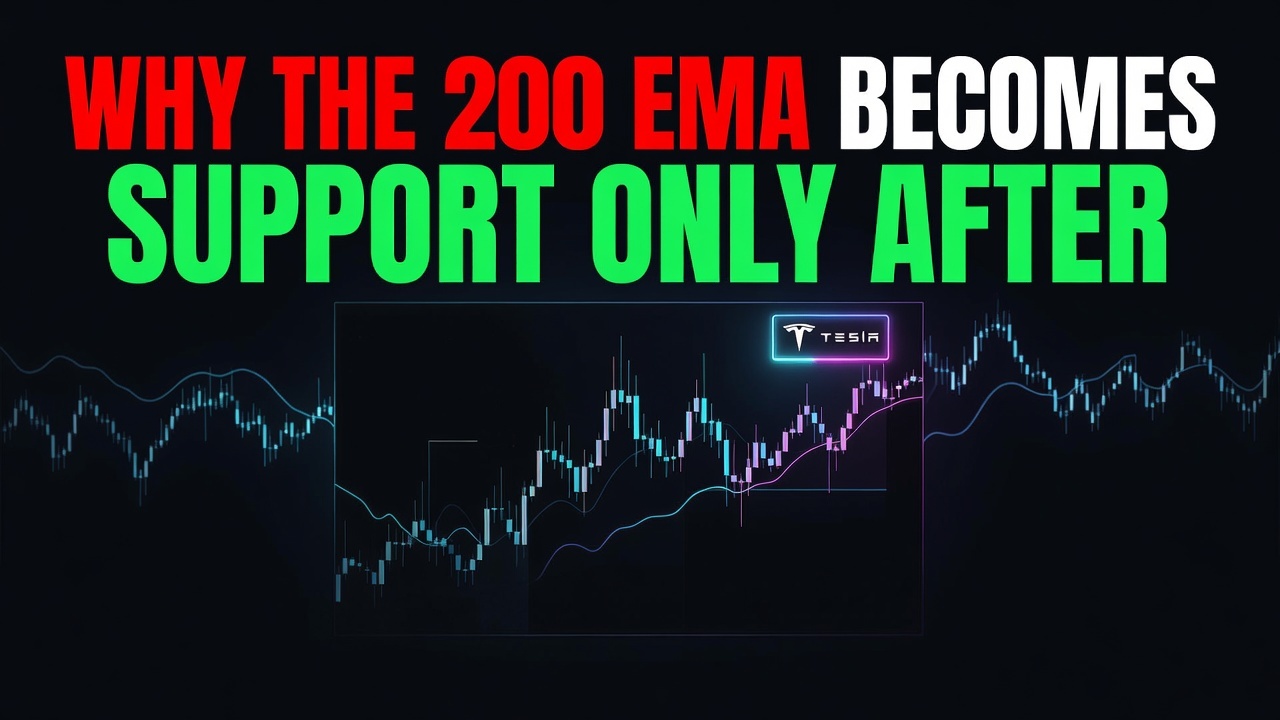
Why the 200 EMA Becomes Support Only After It Sweeps You

📊 September 24, 2026
- The 200 EMA is not an impenetrable floor; it is a massive liquidity magnet where institutions prey on predictable retail limit orders.
- Blindly placing buy orders directly on the moving average line guarantees you will get wicked out right before the real move starts.
- Treat the 200 EMA as a reaction zone and wait for a structural reclaim after the initial sweep before committing capital.
— Ben, Find Better Trades
Most retail traders treat the 200-day exponential moving average like a brick wall that price cannot cross. That is precisely why institutions use it to harvest your stops week after week. If your entire strategy consists of setting a limit buy order directly on that line, you are donating your account balance to market makers.
Why Everyone Gets This Wrong
Amateur traders view the 200 EMA as a rigid barrier because standard trading textbooks claim institutions defend it on contact. What those textbooks leave out is that institutions need massive counterpart volume to fill large orders, and retail stop orders clustered neatly beneath a popular indicator line offer the cleanest pool of liquidity on the board.
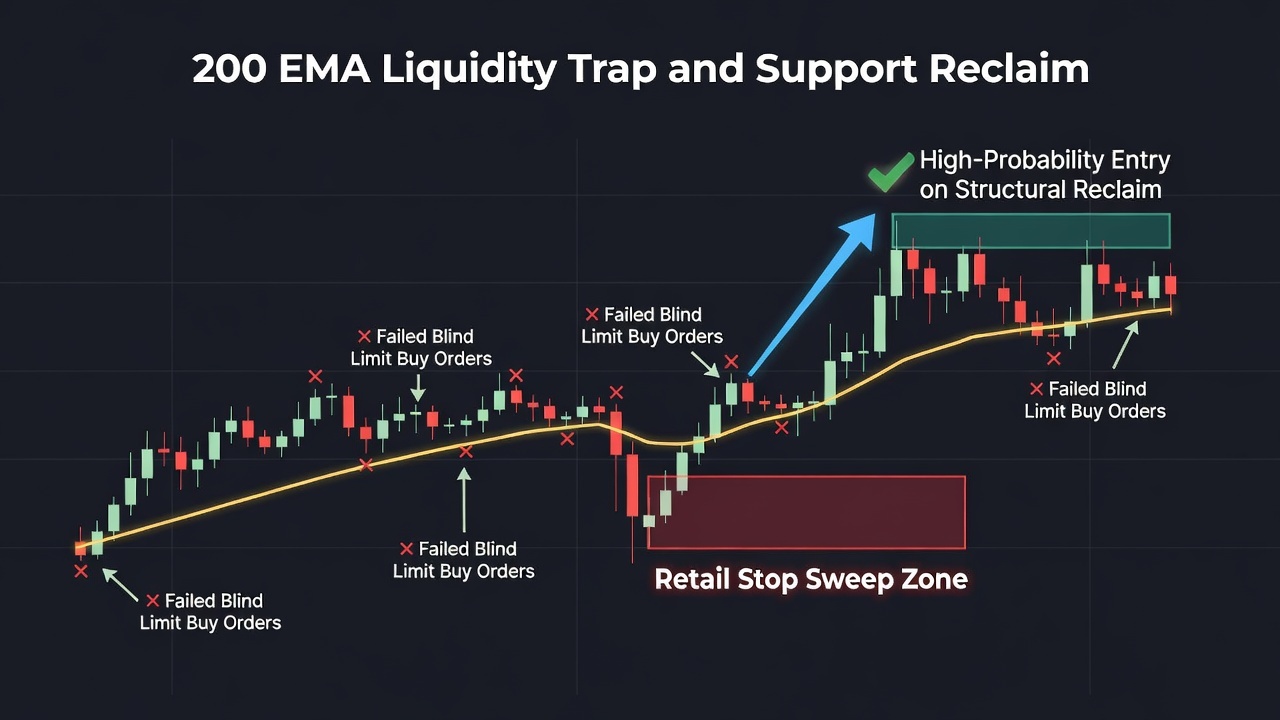
Picture a stock in a healthy higher-timeframe uptrend pulling back toward the rising 200 EMA. Thousands of retail accounts place their buy orders right at the line and tuck their stop-losses just ten cents below it. When price approaches, aggressive sellers punch directly through the line, triggering an avalanche of automated stop orders in a sharp flush.
Retail traders panic, label the price action a breakdown, and dump their positions at the absolute worst price. Minutes later, institutional buyers quietly scoop up that liquidity discount, and price violently snaps back above the average without you on board.
The indicator did not fail. Your rigid, single-line definition of support is what failed.
What Actually Works
Stop looking at the 200 EMA as a razor-thin line and start treating it as a dynamic structural zone. Real institutional buying does not happen on a single tick; it takes multiple pushes and deliberate sweeps to build an accumulation position around a major moving average.
Instead of front-running the touch with a blind limit order, wait for price to intentionally violate the 200 EMA and flush out impatient stops. You want to see sellers exhaust their momentum below the line, followed by an aggressive displacement candle that closes back inside prior market structure.
Once price reclaims the 200 EMA with real volume, look for an entry on the secondary retest of that reclaimed level. This shifts your risk-to-reward ratio dramatically because your invalidation now sits below an established liquidity sweep rather than an arbitrary mathematical line.
You avoid taking the initial flush on the chin, and you enter alongside the actual smart money that engineered the bounce.
When the 200 EMA Can Still Help
The 200 EMA remains on my charts because the sheer volume of global market participants watching it creates undeniable self-fulfilling volatility. When paired with higher-timeframe market structure and horizontal supply and demand zones, it serves as a reliable filter to prevent you from shorting into heavy accumulation.
Use it strictly as a directional filter and an alert zone rather than an automated execution trigger. When you let the crowd get trapped around it first, the indicator transforms from an account-killer into your cleanest edge.
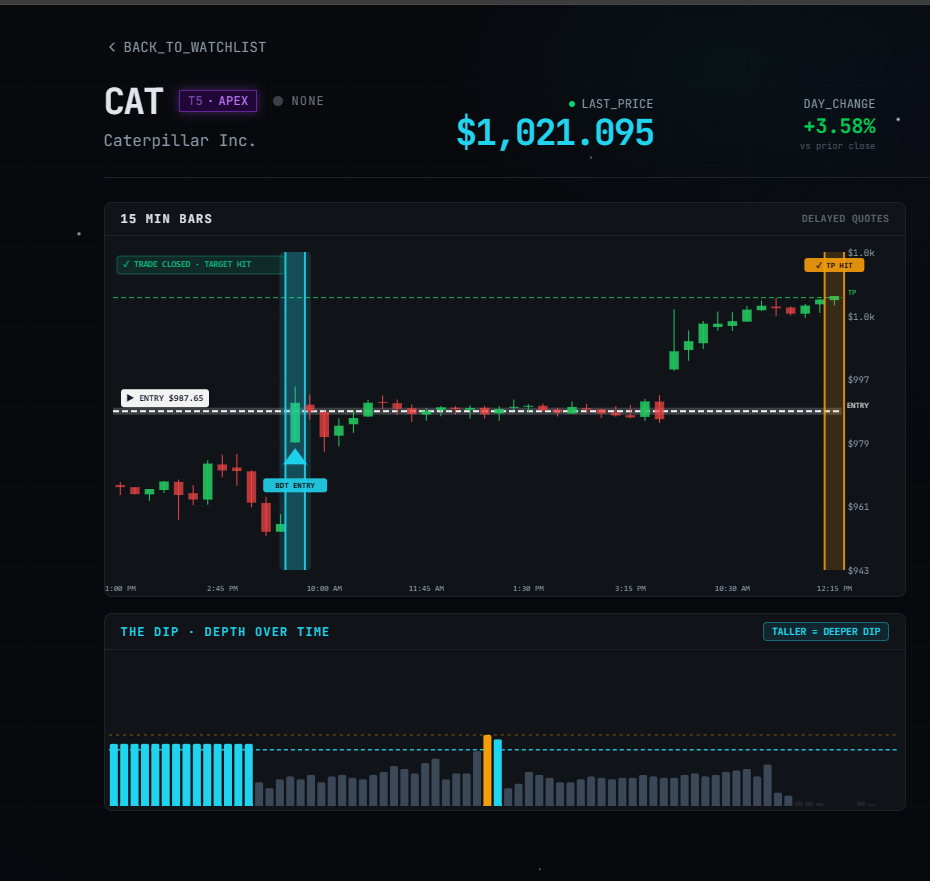
🎯 Want Setups Like These? The Big Dipper Does the Scanning For You.
Every morning the Big Dipper delivers curated DIP ZONE trade ideas — stocks already at high-probability entry levels, with targets pre-set. No guessing, no scanning. Just setups.

200 EMA FAQ
Q: Should I use the 200 SMA or the 200 EMA for dynamic support?
A: The 200 EMA reacts faster to recent price momentum while the SMA represents raw institutional benchmark weight, but neither should be traded as an isolated line. Watch both, treat the space between them as a single reaction buffer, and let price action confirm the turn.
Q: What timeframes work best when trading the 200 EMA?
A: Daily and four-hour charts produce the most reliable structural reactions because heavy institutional order flow operates on those horizons. Sub-fifteen-minute charts produce far too much noise around the 200 EMA to offer any consistent edge without higher-timeframe confluence.
Free For Traders
Get Free Weekly Trade Ideas Sent Straight To Your Phone
Join thousands of traders who get high-probability setups delivered every week — no cost, no catch.

From Find Better Trades
The Pullback Isn’t A Warning. It’s Your Entry.
Slingshot catches the exact moment a trend pause is ready to rip back in your favor — built for explosive pullback continuations.

📈 Want More? Join Our Free Trading Community
- Trading Strategy Guides Telegram — daily strategy tips and market insights
- Find Better Trades Telegram — free trade signals delivered to your phone
- Find Better Trades on YouTube — live trade breakdowns and tutorials


