
Why Stacking 5 Indicators on One Chart Guarantees You Lose Money

📊 August 31, 2026
- Stacking multiple technical indicators does not give you confirmation; it gives you execution paralysis.
- Most popular indicators use the exact same price data inputs, meaning you are looking at identical lagging math displayed in five different colors.
- Strip your charts down to market structure, key liquidity levels, and at most one non-redundant contextual tool.
— Ben, Find Better Trades
If your chart looks like a neon spaghetti factory with RSI, MACD, Bollinger Bands, and four moving averages, you are not being thorough. You are terrified of making an actual trading decision.
I see traders load up subpanel after subpanel convinced that more confirmation equals higher win rates. In reality, indicator stacking guarantees you enter trades too late, exit out of fear, and miss the cleanest moves the market offers.
Why Everyone Gets This Wrong
The standard retail advice tells you to find three or four indicators that agree before pulling the trigger. This sounds logical on paper, but it fundamentally misunderstands what technical indicators actually are: lagging mathematical derivatives of price and volume.
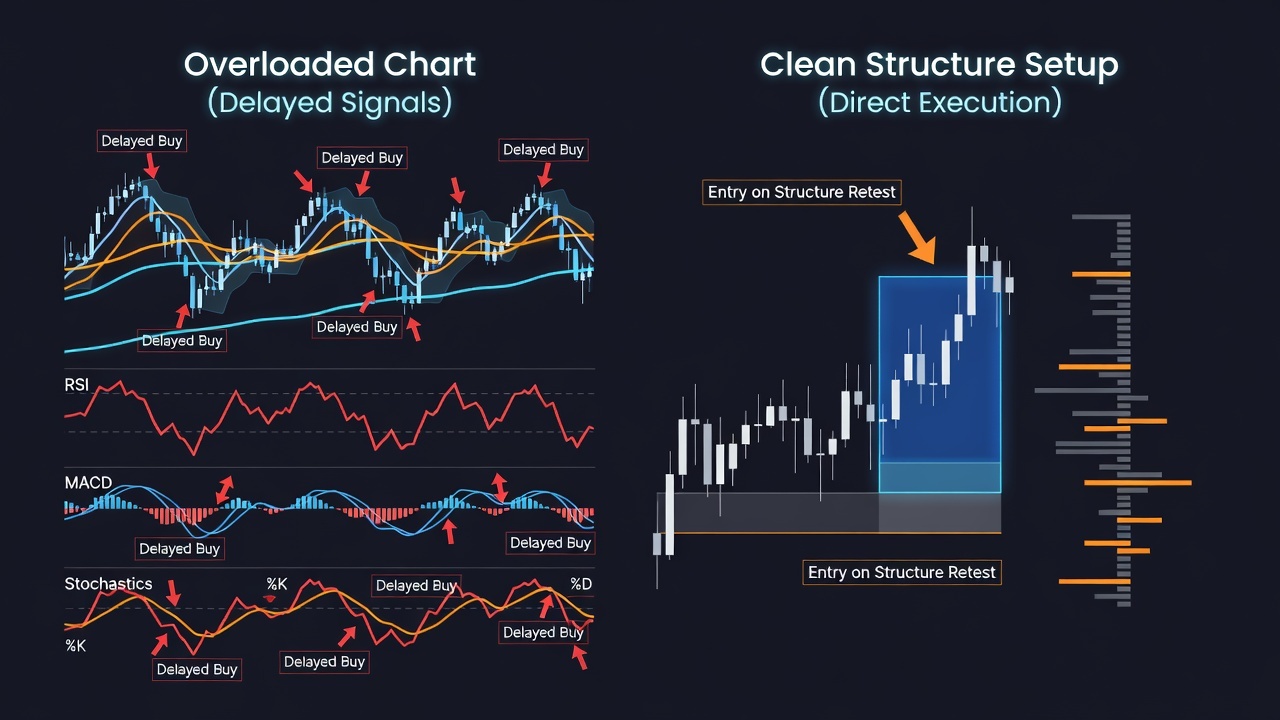
When you stack a 14-period RSI, a standard MACD, and a Stochastic oscillator on the same chart, you are suffering from extreme multicollinearity. All three indicators run formulas based on past closing prices over similar lookback windows. You do not have three independent confirmations; you have one lagging price signal repeated three times.
Consider a classic breakout setup where price compresses against a major resistance level for two weeks before violently expanding upward on massive volume. A clean price-action trader recognizes the compression, sees the liquidity grab, and enters on the immediate breakout or first candle retest.
Now look at what happens to the indicator-heavy trader in that exact scenario. Your Stochastic screams overbought immediately, warning you not to buy. Your MACD histogram is expanding, but the signal line cross has not fully printed yet, while your Bollinger Bands are severely stretched. By the time all four indicators finally line up in clean green agreement, price has already traveled 80% of its impulse move, leaving you buying the exact top right before the pullback.
What Actually Works
Stop trying to outsource your conviction to squiggly lines at the bottom of your screen. Price is the only leading indicator that exists, and your chart needs to reflect price delivery, not mathematical noise.
Start by stripping everything off your chart except raw candlesticks and clear horizontal support and resistance levels. Focus on market structure: identifying higher highs, higher lows, swing point failures, and where trapped liquidity rests above and below consolidation ranges.
If you insist on using an indicator, apply the strict One Tool Rule. Choose a single tool that provides context price action cannot immediately show you, such as Volume Weighted Average Price (VWAP) for institutional intraday bias or a simple Volume Profile to spot high-volume nodes. If an indicator does not provide independent data, delete it immediately.
When you trade naked market structure with clean levels, your execution speed doubles. You stop waiting for permission from three lagging formulas and start reacting to real-time order flow and price acceptance.
When an Extra Tool Can Still Help
Using a secondary indicator makes sense only when the tool measures an entirely independent stream of data that does not mirror raw closing prices. For instance, pairing pure price action with open interest changes or real-time order book delta can provide genuine insight into aggressive market participation.
The moment an extra tool merely recalculates the candles you can already see with your own eyes, it becomes dead weight. Keep your charts brutally simple, preserve your processing speed, and let price action do the heavy lifting.
🎯 Want Setups Like These? The Big Dipper Does the Scanning For You.
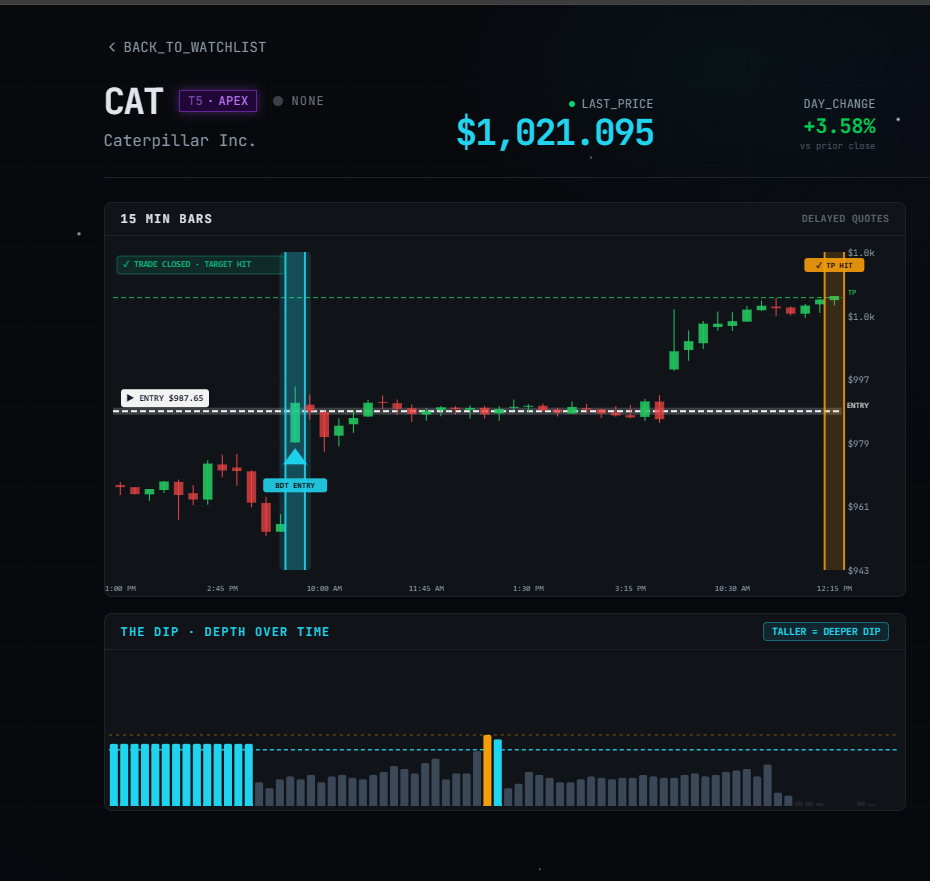
Every morning the Big Dipper delivers curated DIP ZONE trade ideas — stocks already at high-probability entry levels, with targets pre-set. No guessing, no scanning. Just setups.

Indicator Overload FAQ
Q: How many indicators should I have on my trading chart?
A: You should use at most one or two indicators, provided they measure genuinely distinct data like volume profiles rather than redundant price derivatives.
Q: What is indicator redundancy in technical analysis?
A: Indicator redundancy occurs when you combine multiple tools (like RSI, MACD, and Stochastics) that calculate the same underlying price data, giving you a false sense of confirmation while lagging behind price.
Free For Traders
One Clear Arrow. Every High-Probability Setup. Free.
The Fusion Indicator combines multiple signals into a single buy/sell arrow on TradingView so you never miss a move.

From Find Better Trades
Know Exactly Where The Big Money Steps In
Auto-plots institutional support & resistance zones from pure price action — no more guessing at levels.

📈 Want More? Join Our Free Trading Community
- Trading Strategy Guides Telegram — daily strategy tips and market insights
- Find Better Trades Telegram — free trade signals delivered to your phone
- Find Better Trades on YouTube — live trade breakdowns and tutorials


