
Why RSI Overbought Signals Only Matter Near Real Resistance

📊 August 15, 2026
- An RSI above 70 in open air is a sign of runaway buying momentum, not an automatic short signal.
- Traders get destroyed trying to pick tops solely because an arbitrary math formula printed an overbought value.
- Wait for price to physically reject a major horizontal resistance zone before using momentum exhaustion to frame your risk.
— Ben, Find Better Trades
If you blindly short an asset simply because its RSI crosses above 70, you are handing your capital straight to institutional trend followers. An overbought reading on its own tells you one primary thing: buyers have total control and sufficient volume to push momentum hard. The indicator only gives you an edge when that aggressive buying thrust collides directly with a proven structural ceiling on your chart.
Why Everyone Gets This Wrong
Standard textbook trading advice treats the 70 line on the Relative Strength Index like an electric fence. You are told that once price crosses that boundary, the asset is stretched and overdue for an immediate pullback. That simplistic view fails consistently because strong trends routinely keep oscillators pegged above 70 while price climbs another twenty percent.
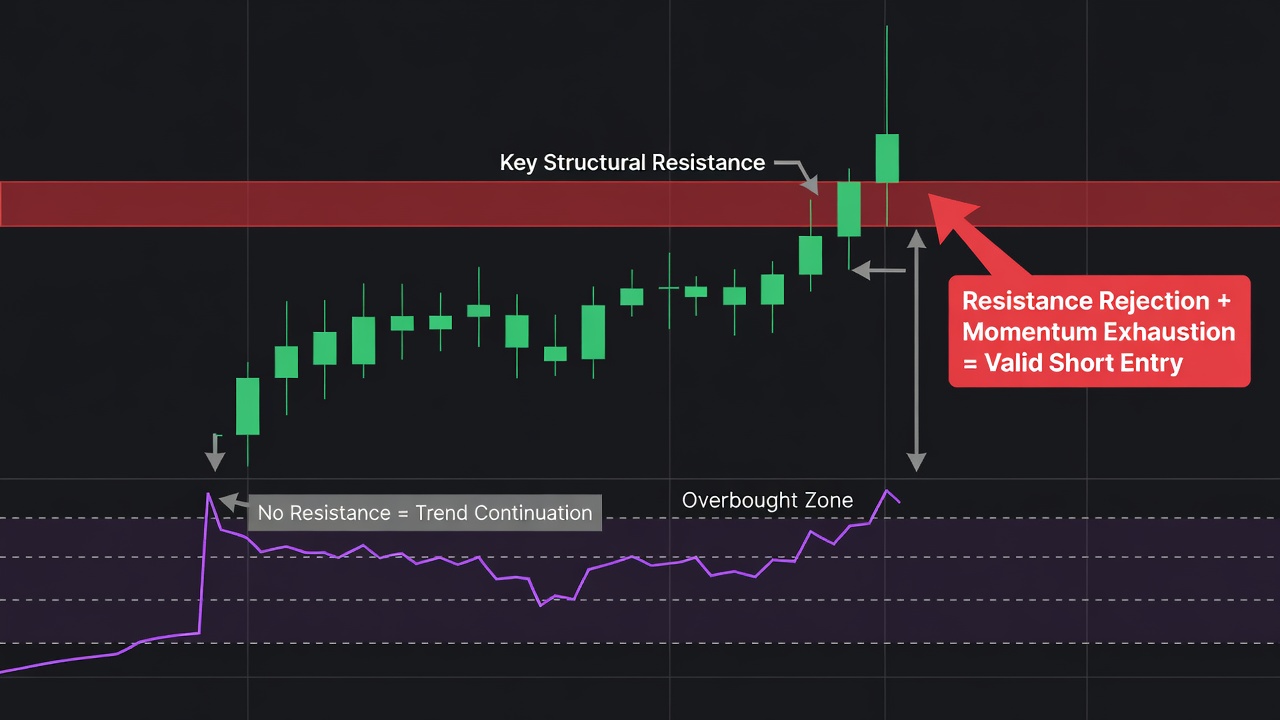
Think about what happens during a clean breakout above a multi-month base. The RSI spikes straight into the mid-70s on heavy expansion volume, which tricks retail traders into stepping directly in front of the move with short orders. With no overhead supply left to absorb the buying pressure, the stock continues ripping higher while the indicator merely hovers in overbought territory.
The RSI does not track absolute valuation or structural supply zones. It measures the velocity and magnitude of recent price moves over your lookback window. A high number simply proves that recent upside gains heavily outweighed downside pullbacks, which is the textbook definition of a powerful trend.
What Actually Works
When markets open Monday, strip the idea of standalone indicator triggers out of your trade planning. The proper execution hierarchy is always structural location first, price action confirmation second, and momentum indicators last. You must locate a significant multi-touch resistance level or major prior high before you care what the oscillator is doing.
When price pushes into that critical zone, watch the individual candle interactions. You want to see clear signs of supply hitting the tape, such as long upper rejection wicks or an inability to print higher closes. Only when price confirms that sellers are defending that structural boundary does an overbought reading become valuable context.
In that specific setup, an overbought RSI signals that aggressive buyers exhausted their momentum pushing directly into heavy liquidity. This gives you a clear asymmetrical entry: your risk is defined tightly just beyond the resistance level, while the stretched momentum offers substantial room for a downside mean-reversion move.
When RSI Can Still Help
RSI is a useful tool when kept strictly in a supporting role. Its real power lies in spotting momentum exhaustion and bearish divergences at predefined supply zones.
When price prints a higher high directly against a heavy weekly resistance level while RSI forms a lower high above 70, you have true technical confluence. That combination proves that underlying buying volume is drying up right where major sellers are waiting to unload size.
🎯 Want Setups Like These? The Big Dipper Does the Scanning For You.
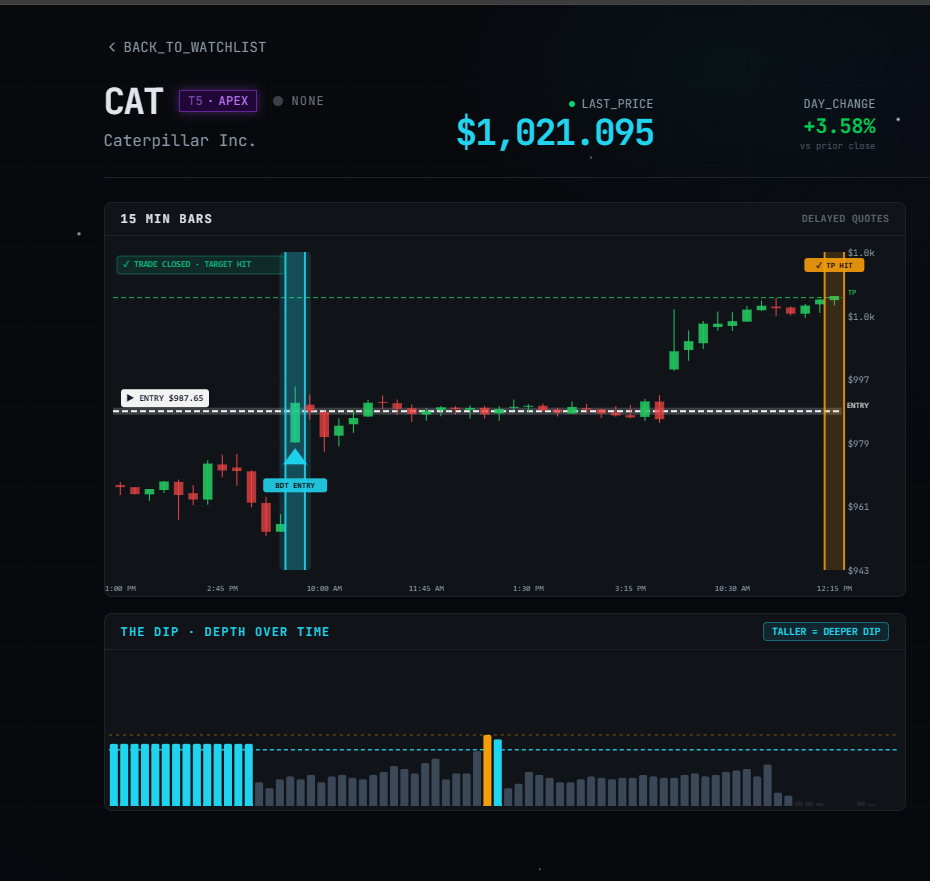
Every morning the Big Dipper delivers curated DIP ZONE trade ideas — stocks already at high-probability entry levels, with targets pre-set. No guessing, no scanning. Just setups.

RSI Overbought FAQ
Q: Should I sell my long position immediately when RSI crosses above 70?
A: No, an RSI crossing 70 often marks the strongest phase of an ongoing trend. Trail your stops below key support levels instead of exiting purely because an oscillator reached an overbought threshold.
Q: Does an overbought RSI work better on higher timeframes?
A: Daily and weekly overbought readings carry significantly more weight than intraday noise, but they still require a clean horizontal price level to trigger a valid reversal trade.
Free For Traders
One Clear Arrow. Every High-Probability Setup. Free.
The Fusion Indicator combines multiple signals into a single buy/sell arrow on TradingView so you never miss a move.

From Find Better Trades
Ride The Trend. Skip The Whipsaw.
Clear directional bias with built-in noise filters and trailing stop logic — from entry to exit.

📈 Want More? Join Our Free Trading Community
- Trading Strategy Guides Telegram — daily strategy tips and market insights
- Find Better Trades Telegram — free trade signals delivered to your phone
- Find Better Trades on YouTube — live trade breakdowns and tutorials


