
Why Most Traders Use the Ichimoku Cloud Completely Wrong


📊 August 27, 2026
- The Ichimoku Cloud is not a crystal ball for future support, and trading every cloud breakout will bleed your trading account dry.
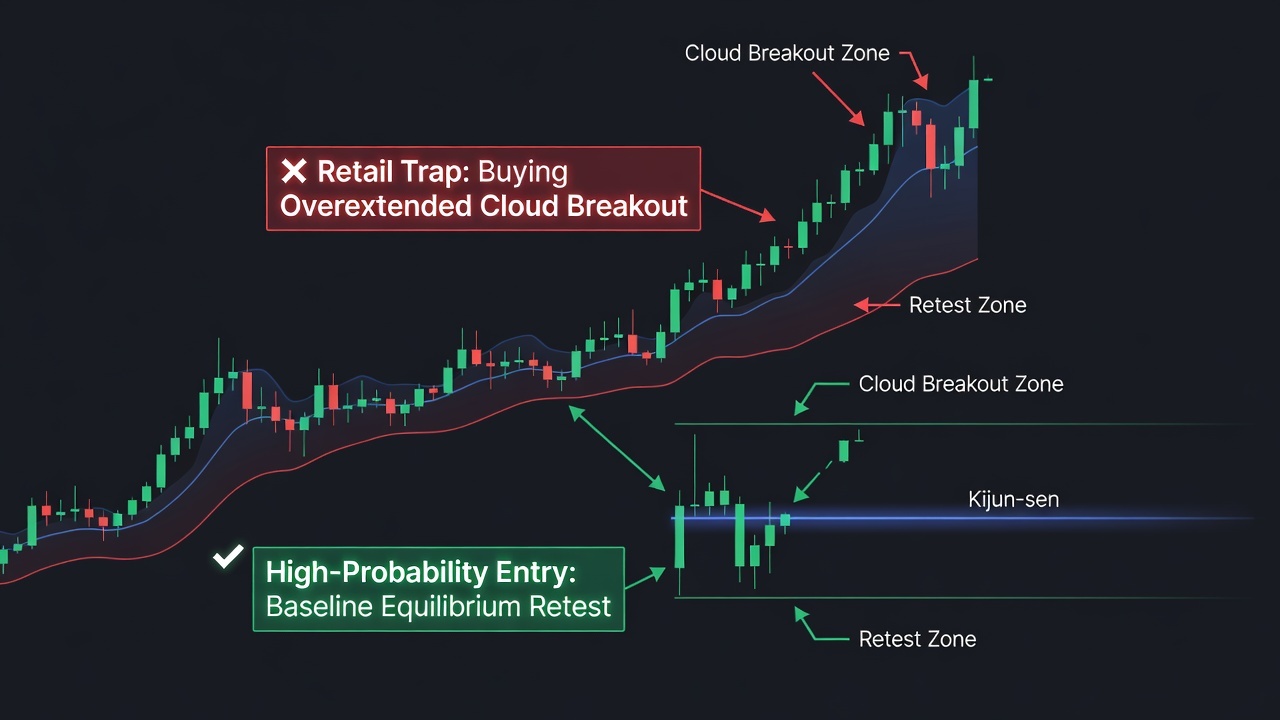
- Most retail traders treat the forward-projected Kumo as a concrete barrier while blindly buying moves that are already heavily overextended from equilibrium.
- Strip off the redundant lines, ignore the lagging span, and use the Kijun-sen baseline as an equilibrium anchor for pullback entries.
— Ben, Find Better Trades
If your chart looks like a tangled mess of five pastel lines and shaded blobs, you are using Ichimoku completely wrong. Goichi Hosoda spent decades building a visual equilibrium system, but retail traders turned it into an overcomplicated lagging mess that generates late signals.
If you keep buying the exact candle where price exits the top of the cloud, you are simply handing liquidity to traders who understand mean reversion.
Why Everyone Gets This Wrong
The standard retail playbook tells you to wait for a Tenkan-Kijun crossover and buy when price punches above the Kumo cloud. By the time that textbook setup prints on your chart, price has already traveled multiple standard deviations from its base and the move is practically over.
Traders mistake the forward projection of the cloud for a magical price prediction. In reality, Senkou Span A and B are just lagged midpoints of past highs and lows plotted 26 candles ahead, carrying zero institutional predictive power on their own.
Think about a setup where an asset consolidates in a range, explodes upward on heavy volume, and runs 12% in three sessions. The cloud expands upward behind it, and retail traders rush in with market buy orders the moment price breaks above the top span. Meanwhile, smart money uses that exact breakout exhaustion to take profits, slamming price back through the hollow cloud and wiping out retail stops.
To make matters worse, most traders keep the Chikou Span cluttering their screen. It is literally just today’s closing price shifted 26 bars backward, adding zero new mathematical information while creating visual noise that paralyzes decision-making.
What Actually Works
Strip the clutter down and focus on what the system was actually built to measure: market balance. The single most valuable line on the indicator is the Kijun-sen (the 26-period baseline), because it marks the true equilibrium level of recent price discovery.
Instead of chasing price as it screams away from the cloud, wait for the rubber band to snap back. When price trends strongly and pulls back to retest a flat Kijun-sen while volume tapers off, you get an asymmetric long entry with a defined stop just below that baseline.
Treat the cloud strictly as a macro regime filter rather than an active entry trigger. If price is above the cloud, you only look for long pullback entries toward the baseline; if price is below, you only short failed retests into resistance.
Pay attention to the cloud’s thickness instead of its exact boundary prices. A thick cloud tells you the market is digesting high historical volatility, while a paper-thin or twisting cloud warns you that the market has lost trend momentum and is about to chop you up.
When Ichimoku Cloud Can Still Help
The indicator excels at keeping you out of bad trades during messy sideways consolidation. When Senkou Span A and B repeatedly twist over each other and run flat, the cloud clearly warns that trend-following strategies will fail.
It also gives you an instant read on trend momentum through the slope of the baseline. When the Kijun-sen angles steeply upward, the trend is healthy; when it flattens into a shelf, it signals an immediate pause where you should protect open profits rather than add new risk.
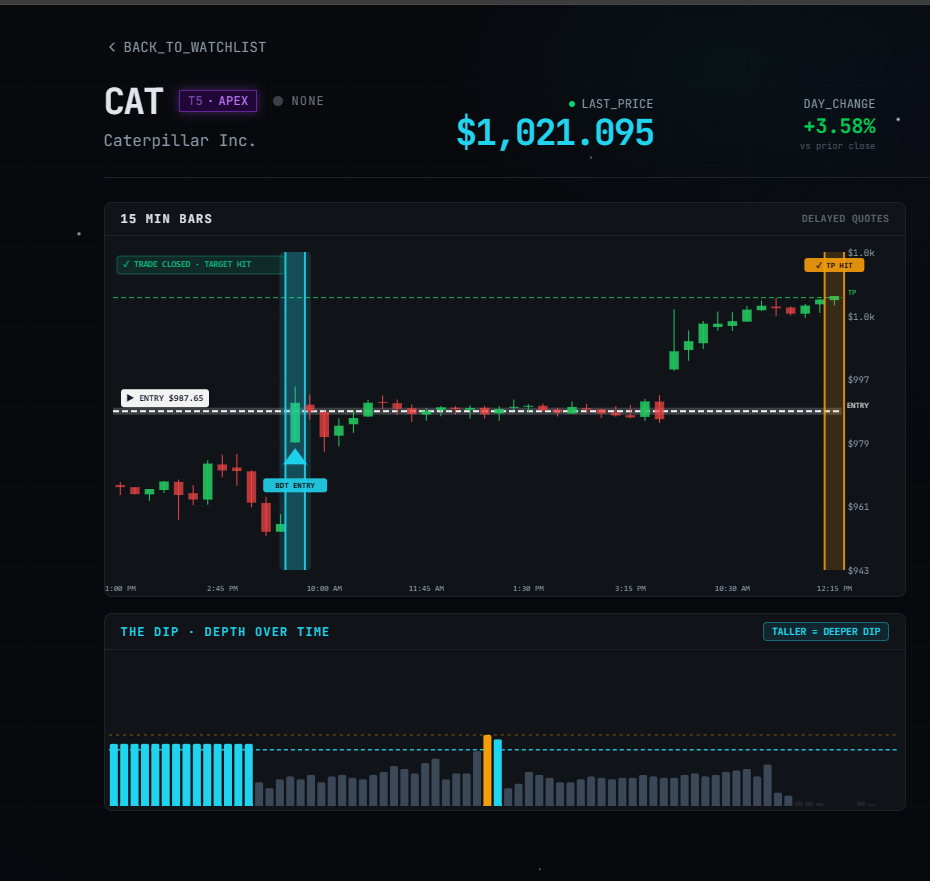
🎯 Want Setups Like These? The Big Dipper Does the Scanning For You.
Every morning the Big Dipper delivers curated DIP ZONE trade ideas — stocks already at high-probability entry levels, with targets pre-set. No guessing, no scanning. Just setups.

Frequently Asked Questions About Ichimoku Cloud
Q: Should I remove the Chikou Span from my Ichimoku chart?
A: Yes, you should turn it off because it is merely current closing price shifted backward by 26 periods and provides no unique data that standard price action does not already show.
Q: What timeframe works best for Ichimoku Cloud strategies?
A: The 4-hour and daily charts work best because lower timeframes create constant false cloud breakouts and noisy line crossovers that trigger excessive whipsaws.
Free For Traders
One Clear Arrow. Every High-Probability Setup. Free.
The Fusion Indicator combines multiple signals into a single buy/sell arrow on TradingView so you never miss a move.

From Find Better Trades
Ride The Trend. Skip The Whipsaw.
Clear directional bias with built-in noise filters and trailing stop logic — from entry to exit.

📈 Want More? Join Our Free Trading Community
- Trading Strategy Guides Telegram — daily strategy tips and market insights
- Find Better Trades Telegram — free trade signals delivered to your phone
- Find Better Trades on YouTube — live trade breakdowns and tutorials


