
Why High Volume Breakouts Trap Retail Traders — And What Works Instead

📊 August 13, 2026
- High volume at key support or resistance usually signals institutional absorption and exhaustion, not an easy continuation entry.
- Retail traders consistently buy high-volume breakout candles straight into institutional liquidity providers sitting on the other side.
- Wait for volume to dry up on light-volume retests or track market structure shifts before placing a single trade.
— Ben, Find Better Trades
If you are still buying every massive green volume spike at resistance and assuming institutional big money is pushing price to the moon, I have bad news for your account. High volume at a key level does not mean what your favorite YouTube guru told you it means. Trading volume spikes blindly at key horizontal levels is one of the fastest ways to hand your hard-earned capital directly to market makers.
Why Everyone Gets This Wrong
The textbook rule claims that a valid breakout requires massive trading volume to confirm buyer enthusiasm. Retail traders see price smash into a key resistance level on a giant volume bar, get terrified of missing the move, and instantly market-order long. They think the institutional crowd is aggressively buying up supply, so they stack their orders right at the top of the range.
Here is what is actually happening behind the scenes on the DOM ladder. That massive volume spike at resistance represents high-frequency absorption, where big institutions are dumping heavy sell orders into late retail buyers. When price hits a known resistance level on record volume, it usually means aggressive buyers are consuming passive liquidity, and once those market buy orders run out, price has nowhere to go but straight down.
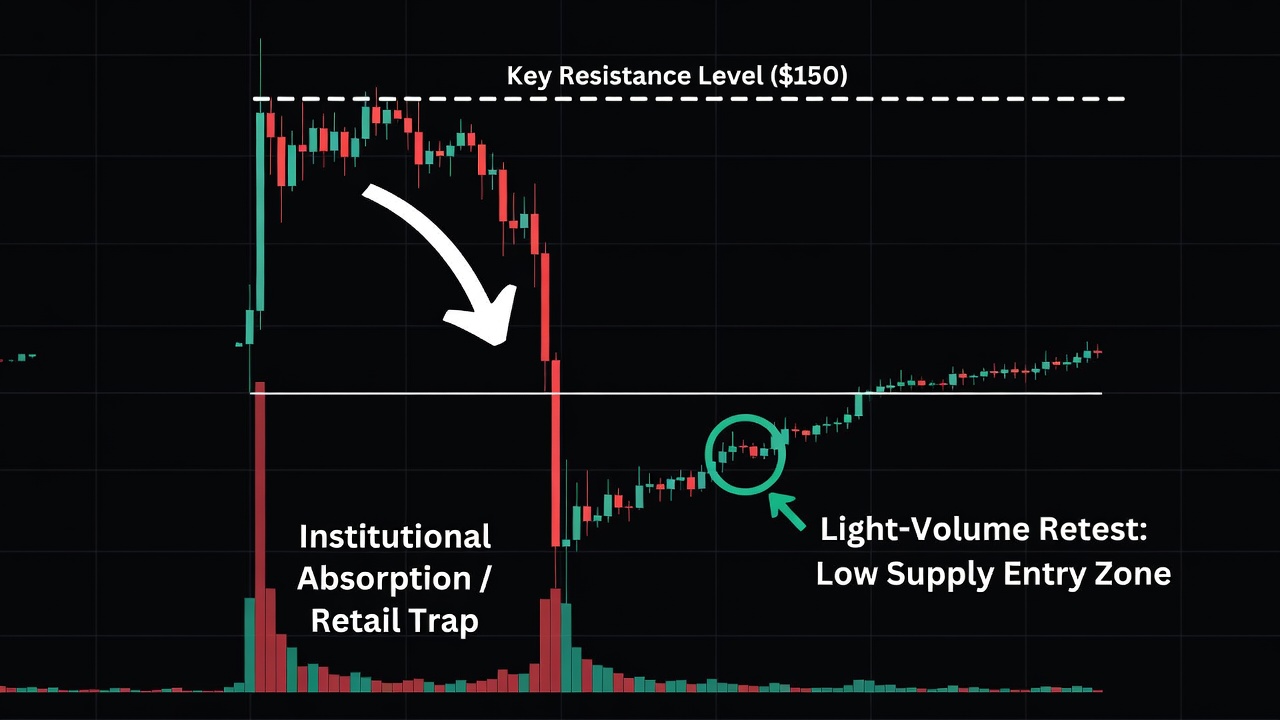
Imagine an asset rallying toward a major multi-week resistance ceiling at $150. Price prints a huge full-bodied bullish candle right into $150 while the volume histogram shows double its daily average. The naive trader calls this a textbook volume breakout, but three candles later, price sharply reverses back down to $142, trapping every single breakout trader above the level.
The exact same trap occurs at key support levels when low-conviction traders panic sell into high volume bottom spikes. When volume explodes at support, smart money is taking the opposite side and absorbing panic sell orders to accumulate long positions. Blindly buying or selling high volume spikes at key levels means you are consistently playing the sucker in institutional liquidity traps.
What Actually Works
If you want to trade support and resistance like someone who actually handles real risk, you need to flip the retail volume playbook on its head. Real continuation across key levels happens when price breaks out cleanly, and then retests the former level on noticeably declining volume. Low volume on a retest proves that selling pressure has completely dried up and sellers have no appetite left to push price lower.
When price pulls back to re-test broken resistance on thin, dropping volume, it signals that supply is fully exhausted. I look for narrow-range candle bodies printing directly on top of the old level while the volume bars bleed lower. That specific combination of price compression and dropping volume tells me institutions are holding their positions while retail sellers refuse to push price back down.
Another reliable technique is utilizing volume profile instead of simple time-based volume bars at the bottom of your chart. Point of Control and High Volume Nodes show you where heavy business was conducted, while Low Volume Nodes represent areas of price rejection. A real trend shift occurs when price moves away from a High Volume Node and accelerates smoothly through a Low Volume Node toward the next structural zone.
Instead of jumping in on the initial high-volume surge, wait patiently for the market to form a higher low above resistance or a lower high below support. When you pair that market structure shift with diminishing counter-trend volume, your hit rate increases dramatically because you are no longer paying market makers for high-slippage liquidity fills.
When Volume Can Still Help
Volume is not a useless metric, but you must respect its real function as a measure of activity rather than directional bias. Volume serves as a reliable warning light when price approaches a major historical level on light volume, which tells you the move lacks institutional participation and is prone to a sharp mean-reversion move.
I also pay close attention to volume divergence when price creates a new higher high into resistance on lower volume than the previous swing high. That divergence confirms buying momentum is fading, giving you a clear signal to trim long positions or prepare for a clean short setup on a structural break.
🎯 Want Setups Like These? The Big Dipper Does the Scanning For You.
Every morning the Big Dipper delivers curated DIP ZONE trade ideas — stocks already at high-probability entry levels, with targets pre-set. No guessing, no scanning. Just setups.


Volume and Support/Resistance FAQ
Q: Should I avoid trading high volume breakouts completely?
A: Yes, unless you are waiting for the initial impulse to settle and entering on the light-volume retest. Chasing the first high-volume breakout bar usually results in buying directly into institutional absorption and bad fills.
Q: How do I know if volume at support is absorption or an actual breakdown?
A: Watch price action immediately after the volume spike prints. If price fails to close lower and quickly reclaims the support level on the next candle, it was institutional absorption, whereas continuous lower closes confirm a real breakdown.
Free For Traders
Get Free Weekly Trade Ideas Sent Straight To Your Phone
Join thousands of traders who get high-probability setups delivered every week — no cost, no catch.

From Find Better Trades
I Only Look For ONE Green Arrow. Here’s Why.
Coiled Spring PRO tracks institutional volume surges and extreme volatility compression — then prints a non-repainting arrow the exact moment a stock is ready to explode. No guessing. No repainting. One arrow.

📈 Want More? Join Our Free Trading Community
- Trading Strategy Guides Telegram — daily strategy tips and market insights
- Find Better Trades Telegram — free trade signals delivered to your phone
- Find Better Trades on YouTube — live trade breakdowns and tutorials


