
Why Bollinger Bands Will Wreck You in Low-Volume Stocks

📊 September 9, 2026
- Standard Bollinger Bands are virtually useless on thin, low-volume tickers because statistical variance collapses when liquidity dries up.
- Thin order books create artificial band squeezes and false breakout triggers caused by single erratic market orders.
- Replace dynamic standard deviation bands with Anchored VWAP and ATR channels to gauge true participant commitment.
— Ben, Find Better Trades
If you are slapping Bollinger Bands onto thin small caps or low-volume microcaps, you are trading visual noise. The indicator assumes continuous liquidity and a normal distribution of returns, neither of which exists when a stock trades sporadic blocks across a wide bid-ask spread. You end up buying phantom oversold bounces and shorting fake squeeze breakouts that exist purely as mathematical artifacts on your screen.
Why Everyone Gets This Wrong
Retail traders love hunting for the classic Bollinger Band squeeze on sleepy tickers. The textbook theory states that when the 20-period moving average flatlines and standard deviation narrows to a sliver, explosive expansion is guaranteed. On liquid names like mega-cap tech, that compression represents genuine institutional accumulation before a trend change.
On low-volume stocks, that tight squeeze is an illusion created by an absent auction. When twenty consecutive bars print with tiny, random fluctuations simply because nobody is participating, the standard deviation formula mechanically drops toward zero. That is not a coiled spring waiting to explode; that is dead water.
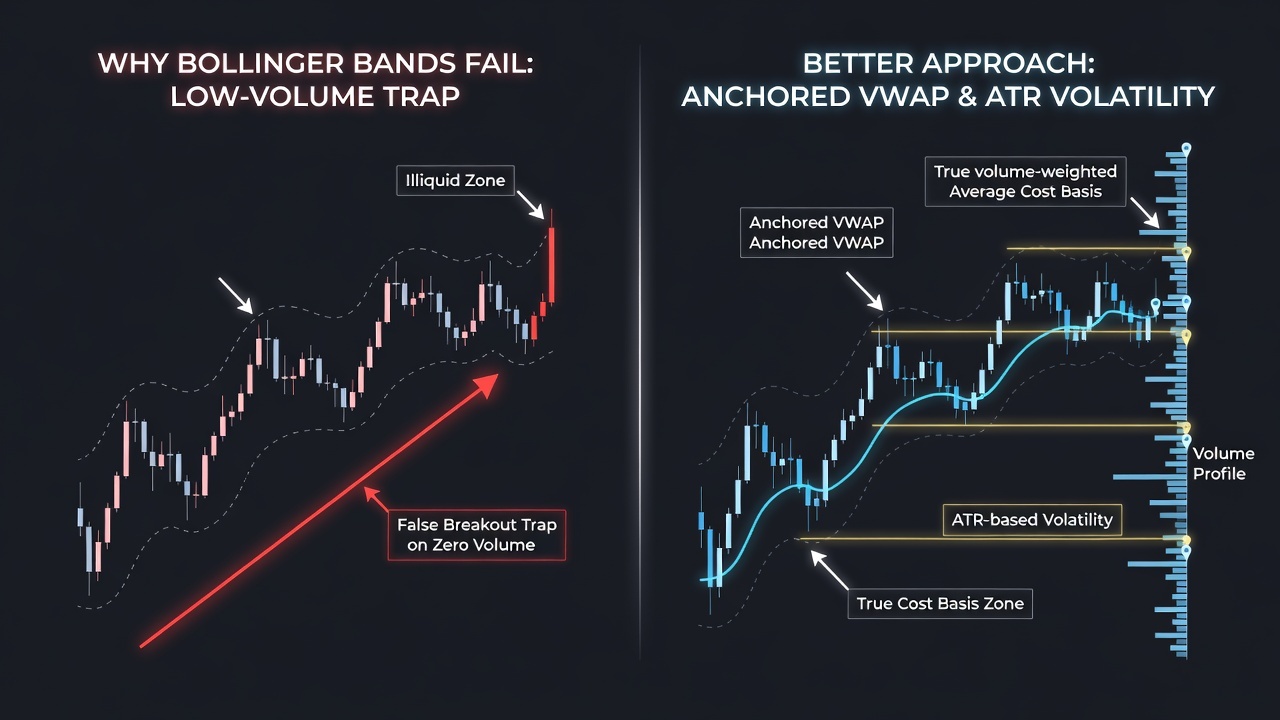
The disaster happens the moment a single retail market order clears out a sparse order book. Price jumps outside the upper band by three standard deviations on one print, flashing an urgent breakout signal across retail scanners. You buy the supposed volatility expansion, but the stock instantly freezes or falls back inside because there were never any resting bids behind that print to support the move.
What Actually Works
Stop trusting standard deviation bands on any instrument where a five-thousand-share order can shift the tape by two percent. If you want to trade lower-liquidity setups, your primary filter must be true capital commitment rather than dynamic statistical curves. You need indicators that measure executed volume rather than smoothed closing prices.
Instead of Bollinger Bands, anchor your analysis to Anchored VWAP originating from the most recent high-volume catalyst day. Anchored VWAP provides an absolute, volume-weighted benchmark showing the exact average price paid by active market participants. When price holds above an Anchored VWAP line on light volume, it confirms buyer control without the deceptive distortions of expanding or contracting band envelopes.
To measure true range expansion without being fooled by spread variance, switch to Average True Range (ATR) multiples plotted as fixed channels from structural swing levels. ATR calculates the actual high-to-low spread and gaps on every candle, immediately exposing wide, erratic spreads that Bollinger Bands mistakenly smooth out. Pair ATR channels with horizontal volume profile shelves to identify real price acceptance.
When Bollinger Bands Can Still Help
Bollinger Bands are reliable tools when applied to deep, highly liquid markets where thousands of orders execute every minute. On high-volume ETFs, mega-caps, and active futures contracts, outer band tags genuinely represent stretched order books and exhaustion points.
Keep Bollinger Bands strictly on tickers that trade millions of shares daily with penny-wide spreads. The moment daily dollar volume drops off, turn the bands off and let horizontal volume structure guide your risk.
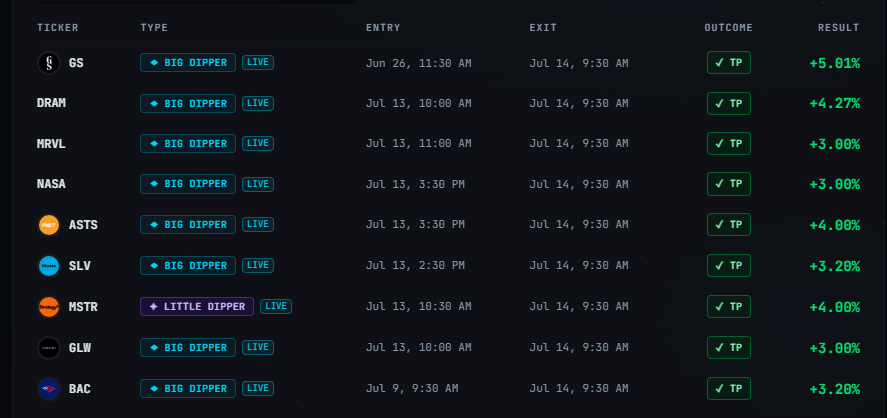
🎯 Want Setups Like These? The Big Dipper Does the Scanning For You.
Every morning the Big Dipper delivers curated DIP ZONE trade ideas — stocks already at high-probability entry levels, with targets pre-set. No guessing, no scanning. Just setups.

Bollinger Bands FAQ
Q: Why do Bollinger Bands generate so many false breakouts on illiquid tickers?
A: Thin liquidity causes wide spreads and sudden price jumps from small orders, tricking the standard deviation calculation into signaling a breakout when no institutional buying exists.
Q: What should I replace Bollinger Bands with when trading small-cap stocks?
A: Use Anchored VWAP to track participant cost basis alongside ATR channels to assess volatility based on actual candle range rather than smoothed variance.
Free For Traders
The Options Cheat Sheet Thousands Of Traders Swear By
Calls, puts, spreads — one free download tells you the right options strategy for every market condition.

From Find Better Trades
Three Candles Tell You When The Move Accelerates
The 3-candlestick reversal pattern indicator that catches the exact moment momentum flips.

📈 Want More? Join Our Free Trading Community
- Trading Strategy Guides Telegram — daily strategy tips and market insights
- Find Better Trades Telegram — free trade signals delivered to your phone
- Find Better Trades on YouTube — live trade breakdowns and tutorials


