
Why Bollinger Bands Lie to You in Low-Volume Stocks

📊 August 22, 2026
- Bollinger Bands are mathematically rigged against you whenever a stock lacks real institutional liquidity.
- Standard deviation calculations break down on wide bid-ask spreads and sparse trades, creating phantom volatility squeezes that trap retail traders.
- Switch off standard deviation envelopes on thin tickers and trade Anchored VWAP with relative volume confirmation instead.
— Ben, Find Better Trades
If you are trying to buy lower-band bounces or trade squeeze breakouts on illiquid stocks, you are handing your capital to market makers on a silver platter. Bollinger Bands rely entirely on standard deviation and normal distributions—assumptions that collapse the moment trading volume evaporates. When order books are thin, every band touch is a mirage.
Why Everyone Gets This Wrong
Standard technical analysis tells you that price piercing the lower band means an asset is oversold, while a tight contraction in band width signals an imminent, explosive breakout. That math works when hundreds of thousands of active shares create fluid price discovery. On a thinly traded ticker, price does not move because of statistical mean reversion; it moves because a single market order wiped out three empty levels on the order book.
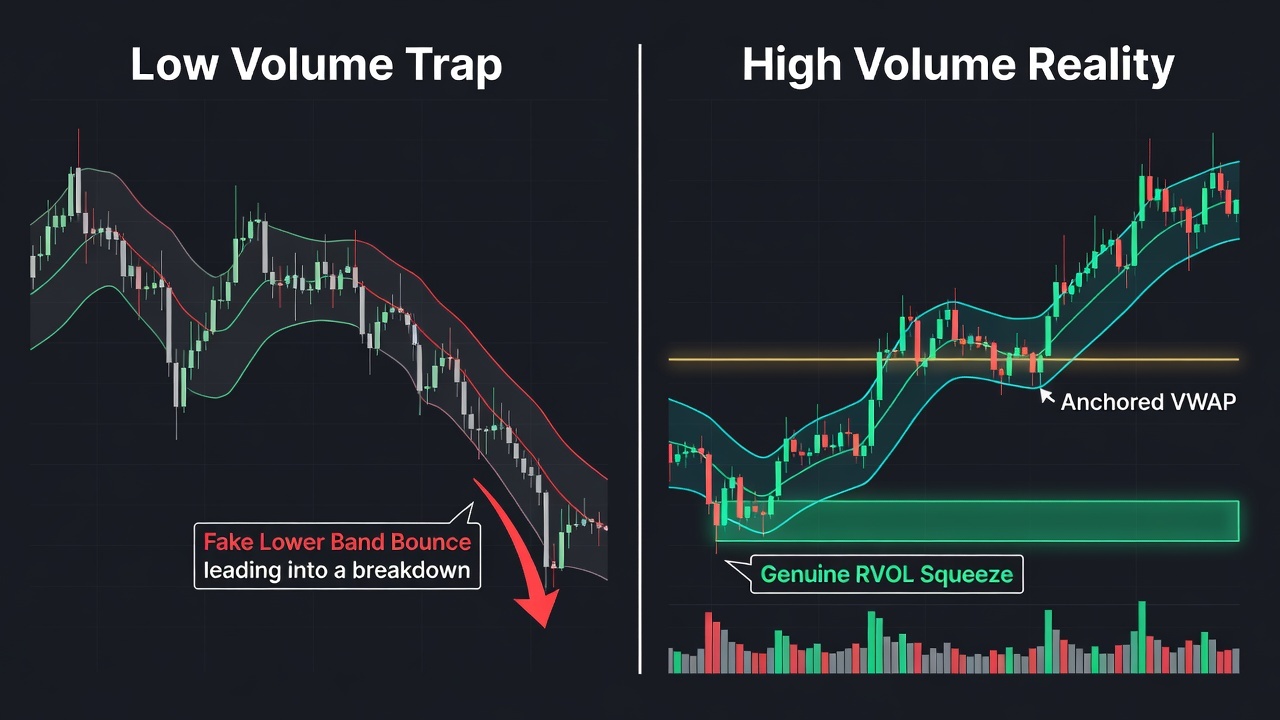
Imagine a low-volume stock trading with a wide spread where a single seller dumps ten thousand shares. That single print artificially spikes the 20-period standard deviation, causing the lower band to violently flare downward. Retail traders watching their screens assume the stock is stretched to an extreme and buy the dip, expecting a rubber-band snap back toward the middle band.
Instead of bouncing, price drifts sideways into complete illiquidity. The bands slowly compress around the new depressed price, your stop gets chewed up by spread friction, and you end up trapped in a dead position with zero liquidity to exit cleanly. You were not trading a high-probability mean reversion setup; you were tricked by an arithmetic quirk of an empty tape.
What Actually Works
Heading into next week, step one is clearing Bollinger Bands off any chart that fails to trade at least one million shares daily. If a ticker lacks the liquidity required for continuous statistics, you need indicators that measure where actual money changed hands. Replace your 20-period bands with an Anchored VWAP plotted from the origin of the most recent high-volume impulse.
Pair your Anchored VWAP with a strict Relative Volume (RVOL) filter. Never trust a price breakout or support bounce on an illiquid chart unless RVOL spikes to at least double the baseline average for that specific time of day. High relative volume confirms that real market participants are defending levels rather than a lone algorithmic specialist hunting resting stop orders.
When markets open Monday, wait for aggressive volume to print first before taking a position. If a low-volume stock consolidates tightly, refuse to call it a volatility squeeze until volume expands and price holds above the Anchored VWAP. Trading real institutional commitment beats chasing mathematical envelopes every single time.
When Bollinger Bands Can Still Help
Bollinger Bands remain an exceptional trading tool when you apply them strictly to highly liquid instruments like mega-cap equities, major index ETFs, and high-volume futures contracts. In those liquid arenas, institutional order flow maintains a tight bell curve where standard deviations actually reflect statistical price exhaustion and genuine band squeezes.
Reserve the indicator for deep, liquid markets where math aligns with reality, and leave it off your small-cap screens entirely.
🎯 Want Setups Like These? The Big Dipper Does the Scanning For You.
Every morning the Big Dipper delivers curated DIP ZONE trade ideas — stocks already at high-probability entry levels, with targets pre-set. No guessing, no scanning. Just setups.


Bollinger Bands in Low-Volume Stocks FAQ
Q: Why do Bollinger Bands generate so many false signals on low-volume stocks?
A: Low trading volume creates wide bid-ask spreads and erratic prints that distort the standard deviation formula, causing the bands to expand and contract without any genuine institutional accumulation or distribution behind the move.
Q: What is the best alternative indicator for trading low-volume stocks?
A: Use Anchored VWAP combined with Relative Volume (RVOL) to identify precise price levels where actual volume entered the market rather than relying on statistical volatility envelopes.
Free For Traders
One Clear Arrow. Every High-Probability Setup. Free.
The Fusion Indicator combines multiple signals into a single buy/sell arrow on TradingView so you never miss a move.

From Find Better Trades
Only Trade When Momentum Is HEAVILY In Your Favor
The Power Index oscillator measures trend conviction at a glance — it filters out weak, choppy action so you only take the strong moves.

📈 Want More? Join Our Free Trading Community
- Trading Strategy Guides Telegram — daily strategy tips and market insights
- Find Better Trades Telegram — free trade signals delivered to your phone
- Find Better Trades on YouTube — live trade breakdowns and tutorials


