
Why Bollinger Bands Fail Unless Paired With Key Price Levels

📊 August 7, 2026
- Bollinger Bands are volatility envelopes, not standalone buy or sell triggers.
- The deadly trap is fading an outer band during a trend expansion without checking price structure.
- Map horizontal support and resistance first, then use outer band touches strictly as confluence triggers.
— Ben, Find Better Trades
Stop buying the lower Bollinger Band just because price touched it. Most retail traders treat dynamic bands like magic reversal walls, and that naive assumption is why their trading accounts keep bleeding out.
If you trade band touches in a vacuum, you are gambling against momentum. Real market edge comes from location, not squiggly dynamic lines floating on a chart.
Why Everyone Gets This Wrong
The classic trading textbook tells you that price stays inside the bands ninety-five percent of the time. Because of that statistic, beginner traders jump in with counter-trend orders the moment price pierces an outer band, expecting an instant mean reversion back to the middle line.
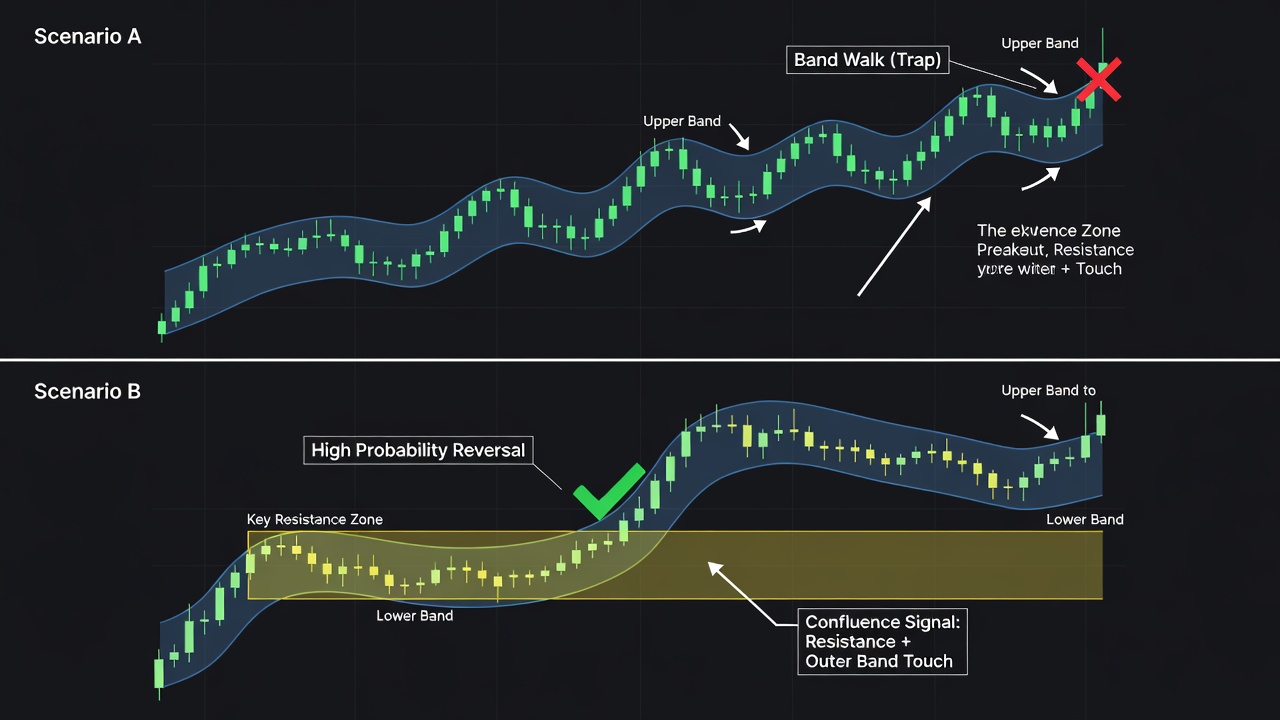
Here is what the indicator creators never emphasize enough: Bollinger Bands measure standard deviation and relative volatility, not market direction. When a real trend starts, a market undergoes massive volatility expansion, causing price to hug or ride the outer band for extended periods.
Imagine an asset consolidating tightly before breaking out above a major multi-week high. As momentum buyers rush in, the bands widen dramatically, and price continuously pushes the upper band higher bar after bar. The amateur trader who keeps shorting each upper band test gets run over repeatedly, taking max-loss stopouts on a move that was obviously bullish to anyone watching market structure.
Fading an outer band during a breakout is identical to standing on the tracks trying to tag a speeding locomotive. Without context, an overextended indicator reading simply means momentum is strong, not that a reversal is mandatory.
What Actually Works
To trade Bollinger Bands profitably, you must invert your process completely. Throw out the indicator-first mindset and start every session with a completely clean chart that highlights critical horizontal levels.
Mark out your key price levels first—prior daily highs and lows, major supply and demand blocks, or clear multi-touch horizontal support and resistance zones. These are the physical locations where institutional liquidity actually resides.
Once price approaches one of these predetermined horizontal zones, only then do you look at your Bollinger Bands for validation. If price pierces the upper band at the exact moment it tests a major daily resistance level, you suddenly have high-probability confluence.
This combination works because you are fusing structural liquidity with a statistical overextension signal. You aren’t blindly guessing that price will magically turn around; you are taking a calculated position at a proven price boundary where institutional supply is waiting to absorb retail momentum.
When Bollinger Bands Can Still Help
Bollinger Bands are far from useless when applied with the right intent. Their greatest strength is pinpointing volatility compression and measuring expansion cycles before price arrives at crucial chart locations.
When the outer bands contract into an extremely narrow channel—often called a band squeeze—it tells you that market energy is building up for an aggressive expansion move. If that squeeze breaks out directly into a major higher-timeframe price level, it provides early warning to prepare for a explosive trade setup.
🎯 Want Setups Like These? The Big Dipper Does the Scanning For You.
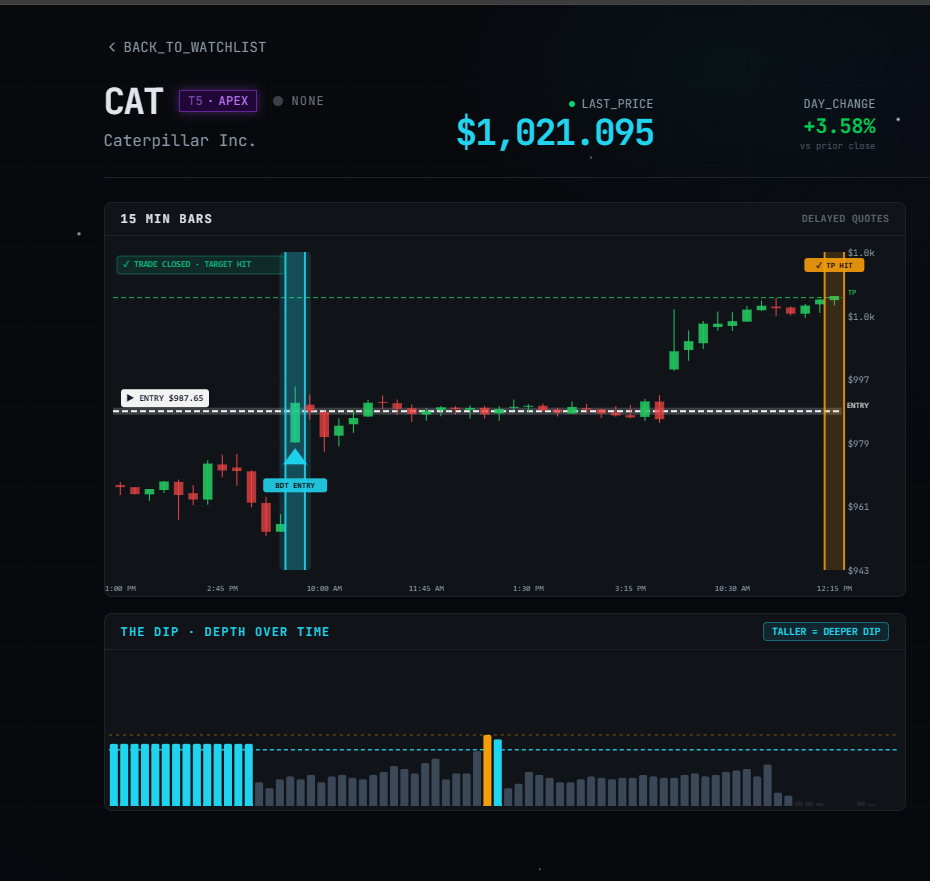
Every morning the Big Dipper delivers curated DIP ZONE trade ideas — stocks already at high-probability entry levels, with targets pre-set. No guessing, no scanning. Just setups.

Bollinger Bands FAQ
Q: Should I change the standard 20-period and 2-deviation settings for short-term trading?
A: Keep the default settings because millions of algorithmic systems and institutional traders monitor those exact metrics. Adjusting settings won’t fix a strategy that ignores horizontal market structure.
Q: What timeframe works best when combining bands with key price levels?
A: The 1-hour and 4-hour timeframes offer the ideal balance between clean horizontal structure and clear volatility expansions. Lower timeframes produce excessive dynamic noise and trigger far too many false overextension readings.
Free For Traders
One Clear Arrow. Every High-Probability Setup. Free.
The Fusion Indicator combines multiple signals into a single buy/sell arrow on TradingView so you never miss a move.

From Find Better Trades
Only Trade When Momentum Is HEAVILY In Your Favor
The Power Index oscillator measures trend conviction at a glance — it filters out weak, choppy action so you only take the strong moves.

📈 Want More? Join Our Free Trading Community
- Trading Strategy Guides Telegram — daily strategy tips and market insights
- Find Better Trades Telegram — free trade signals delivered to your phone
- Find Better Trades on YouTube — live trade breakdowns and tutorials


