
Why ATR Is the Most Underrated Indicator in Your Entire Toolbox

📊 September 7, 2026
- Average True Range is not an entry trigger; it is the only mathematical shield you have against getting chopped to pieces by normal market noise.
- Most retail traders blow up because they attach arbitrary, fixed-dollar or fixed-pip stops to assets that move with shifting, living volatility.
- Tie your stop-loss buffer and position sizing directly to a multiple of ATR so the market dictates your risk boundaries, not your hope.
— Ben, Find Better Trades
Most traders waste hundreds of hours hunting for magic entry signals, squinting at complex oscillators while ignoring the exact reason their accounts bleed out. You do not fail because your directional bias is wrong; you fail because your stop loss is completely blind to volatility. Average True Range is the most overlooked tool on your screen, and using it properly is the difference between surviving a chop cycle and getting liquidated.
If you are still setting static 20-pip stops or fixed dollar stops because that is what feels comfortable to your account balance, you are donating liquidity to the street. Markets do not care about your personal risk comfort zone. They move according to active volatility, and ATR is the only standard indicator that measures that reality without feeding you directional fairy tales.
Why Everyone Gets This Wrong
The standard retail playbook treats ATR like a useless little squiggly line sitting at the bottom of the chart. Beginners pull it up, notice the number says twelve points or forty pips, nod their heads, and then proceed to place an arbitrary stop right where everyone else does. They look for prediction instead of measurement.
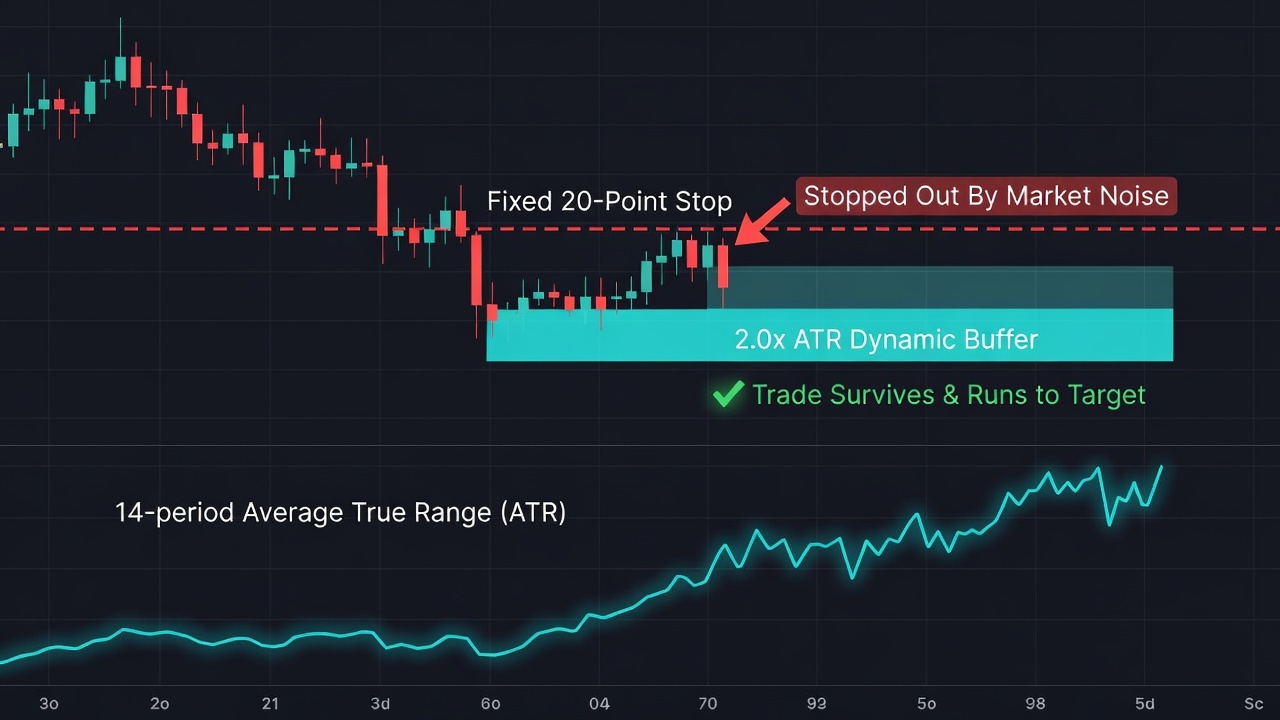
Consider a textbook technical trade on a liquid asset consolidating at a key support floor. Over the past five days, the daily range has compressed to roughly twenty points per day, and a trader places their stop loss fifteen points below the entry level. That fifteen-point stop represents 75 percent of the instrument’s daily movement, which gives the trade plenty of technical breathing room.
Fast-forward two weeks when macro catalysts kick in and the exact same asset begins printing wide bars with an ATR of sixty points per day. The undisciplined trader enters another clean breakout setup on the exact same support retest and casually sets that identical fifteen-point stop loss because that is their static habit. Within three minutes of the opening bell, a tiny, routine wiggle sweeps them out for a loss before the market surges straight toward their profit target.
The trader logs off furious, convinced an algorithm hunted their order specifically. The brutal truth is that their technical thesis was completely correct, but their risk structure was utterly incompetent. A fifteen-point stop during a sixty-point volatility regime is not a risk barrier; it is financial suicide placed directly inside normal random variance.
Markets contract and expand like lungs. When you insist on trading with fixed, static stop distances across changing market regimes, you choke your winning setups to death during high volatility and risk far too much capital during dead consolidations.
What Actually Works
You need to stop letting your emotions choose your stop distance and start letting volatility dictate it mathematically. The solution is dead simple: calculate your stop loss as a direct multiple of the current 14-period ATR, preferably between 1.5x and 2.0x ATR away from your technical invalidation level.
Say you spot a high-probability breakout retest at structural support. Instead of slapping a stop five ticks under the swing low, measure the current ATR on your trading timeframe. If your ATR reads four points, a 2.0x ATR buffer means your stop loss belongs eight points below that structural level, safely outside the baseline chop.
Now comes the crucial step where most traders fold: you must let the ATR stop determine your position size, never the other way around. If eight points feels like too much money to lose on a full contract or standard lot, you do not pull the stop closer to squeeze into the trade. You reduce your position size until that eight-point distance equals your precise one-percent or two-percent account risk threshold.
This single rule changes everything about your execution curve. When the market turns wild and unpredictable, ATR expands, forcing your stops wider and automatically slashing your position size to keep your total cash risk identical. When the market goes quiet and tight, ATR shrinks, allowing you to run tighter stops and scale up position size safely without taking on excess variance.
You are no longer guessing what normal price action looks like. You have a dynamic, self-adjusting risk framework that adapts instantly whether you are trading a sleepy summer consolidation or an explosive earnings season.
When ATR Can Still Help
ATR will not predict the future, and you should never use it as a standalone signal to buy or sell. An expanding ATR reading simply tells you that bars are getting wider; it does not tell you if smart money is accumulating or distributing, and trying to short a market just because ATR looks exhausted is a fast track to pain.
Its legitimate value is purely operational: it is your sizing guide, your stop-placement ruler, and your dynamic trailing-stop engine. Pair ATR with clean price structure—support zones, trendlines, and supply blocks—and use it strictly as the defensive armor that keeps you alive while your edge plays out.
🎯 Want Setups Like These? The Big Dipper Does the Scanning For You.
Every morning the Big Dipper delivers curated DIP ZONE trade ideas — stocks already at high-probability entry levels, with targets pre-set. No guessing, no scanning. Just setups.


Frequently Asked Questions About ATR
Q: What is the best ATR period and multiplier to use for day trading stops?
A: A standard 14-period ATR combined with a 1.5x to 2.0x multiplier gives you the cleanest balance between staying clear of random noise and keeping your capital exposure reasonable.
Q: Should I use ATR on the daily chart if I enter trades on the 5-minute chart?
A: Calculate your ATR directly on the timeframe where your execution structure lives, though monitoring the daily ATR helps you gauge how much total juice the market has left for the session.
Free For Traders
Know What To Trade BEFORE The Opening Bell
The Big Dipper Dashboard hands you curated high-probability setups every single morning — free.

From Find Better Trades
High-Win-Rate Patterns, Spotted In Real Time
Automated pattern recognition for reversals and continuations — no manual drawing, no missed setups.

📈 Want More? Join Our Free Trading Community
- Trading Strategy Guides Telegram — daily strategy tips and market insights
- Find Better Trades Telegram — free trade signals delivered to your phone
- Find Better Trades on YouTube — live trade breakdowns and tutorials


