
VWAP vs Moving Averages: Stop Using MAs on Intraday Charts

📊 August 26, 2026
- VWAP is the only benchmark that matters intraday because institutions actually execute against it.
- Moving averages treat a 100-share retail tick the same as a 500,000-share institutional block, creating lagging false signals.
- Strip the moving average spaghetti off your day trading screens and build your execution around VWAP and standard deviation bands instead.
— Ben, Find Better Trades
If you are day trading with a ribbon of moving averages plastered across your 5-minute chart, you are trading blindfolded. Moving averages belong on daily swing charts, not on intraday execution screens where volume dictates liquidity. The institutions moving billions across the tape do not care about your 9 EMA crossover.
Why Everyone Gets This Wrong
Retail trading tutorials love moving averages because simple crossovers look pretty in cherry-picked screenshots. The fatal flaw is basic math: a moving average only measures price over arbitrary time increments, completely ignoring whether volume supported the move.
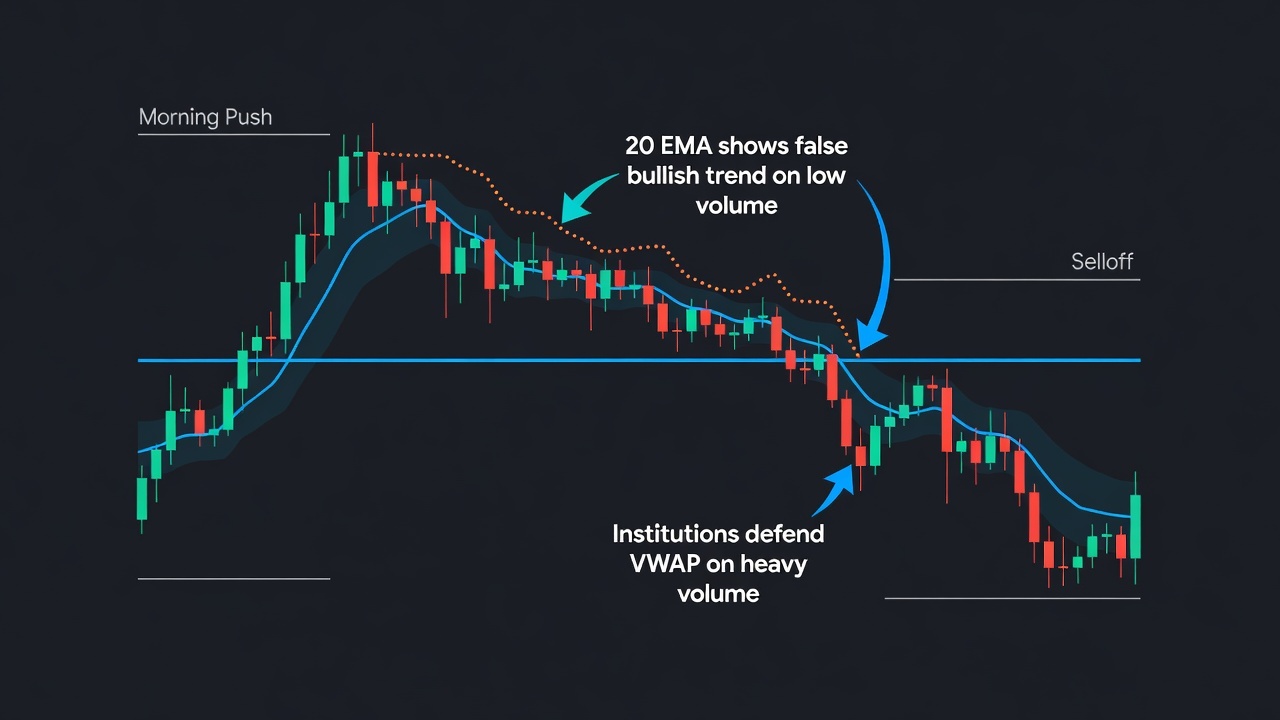
Think about what happens during a morning session. A stock drifts higher on light liquidity, printing higher candle closes on barely ten thousand shares total. A 20 EMA will slope aggressively upward, flashing a buy signal right into the open.
Then the opening bell rings, and an institutional desk dumps two million shares into that bid at a slightly lower price. Your moving average is still happily pointing up because of past price closes, while the real money just hammered the price straight below the session Volume-Weighted Average Price.
You buy the moving average bounce and get smoked instantly. You were looking at an arithmetic average of past candles while the smart money was looking at where volume actually exchanged hands.
What Actually Works
Delete the 9, 20, and 50-period moving averages from your intraday layouts today. Replace them with the standard session VWAP and its first and second standard deviation bands.
VWAP tells you the exact fair value price weighted by every single share traded since the opening bell. When price trades above a rising VWAP, buyers control the auction and every pullback to the line represents institutional inventory reloads.
Take your execution a step further by using Anchored VWAP from key intraday inflection points. Anchor a line to the market open, the high of the day, or a high-volume earnings release candle.
This shows you the exact average price paid by all market participants since that specific event took place. When price interacts with that anchored line, you are trading against real participant breakeven levels rather than an arbitrary 20-bar formula.
When Moving Averages Can Still Help
Moving averages are not completely useless; they are just misused by day traders. A 50-day or 200-day simple moving average on a daily chart is great for identifying broader market regime and establishing your high-level directional bias before the opening bell.
Use higher-timeframe moving averages to pick your lane for the week, but keep them off your 1-minute and 5-minute charts when it is time to pull the trigger.
🎯 Want Setups Like These? The Big Dipper Does the Scanning For You.
Every morning the Big Dipper delivers curated DIP ZONE trade ideas — stocks already at high-probability entry levels, with targets pre-set. No guessing, no scanning. Just setups.


VWAP vs Moving Averages FAQ
Q: Is VWAP better than the 9 EMA for day trading?
A: Yes, because VWAP factors in transaction volume and institutional execution benchmarks, whereas the 9 EMA only averages past closing prices regardless of trade size.
Q: Can I use regular VWAP on daily and weekly swing charts?
A: Standard session VWAP resets every morning and is useless for multi-day swings. Use an Anchored VWAP anchored to a major swing low or earnings date for multi-day analysis instead.
Free For Traders
One Clear Arrow. Every High-Probability Setup. Free.
The Fusion Indicator combines multiple signals into a single buy/sell arrow on TradingView so you never miss a move.

From Find Better Trades
Only Trade When Momentum Is HEAVILY In Your Favor
The Power Index oscillator measures trend conviction at a glance — it filters out weak, choppy action so you only take the strong moves.

📈 Want More? Join Our Free Trading Community
- Trading Strategy Guides Telegram — daily strategy tips and market insights
- Find Better Trades Telegram — free trade signals delivered to your phone
- Find Better Trades on YouTube — live trade breakdowns and tutorials


