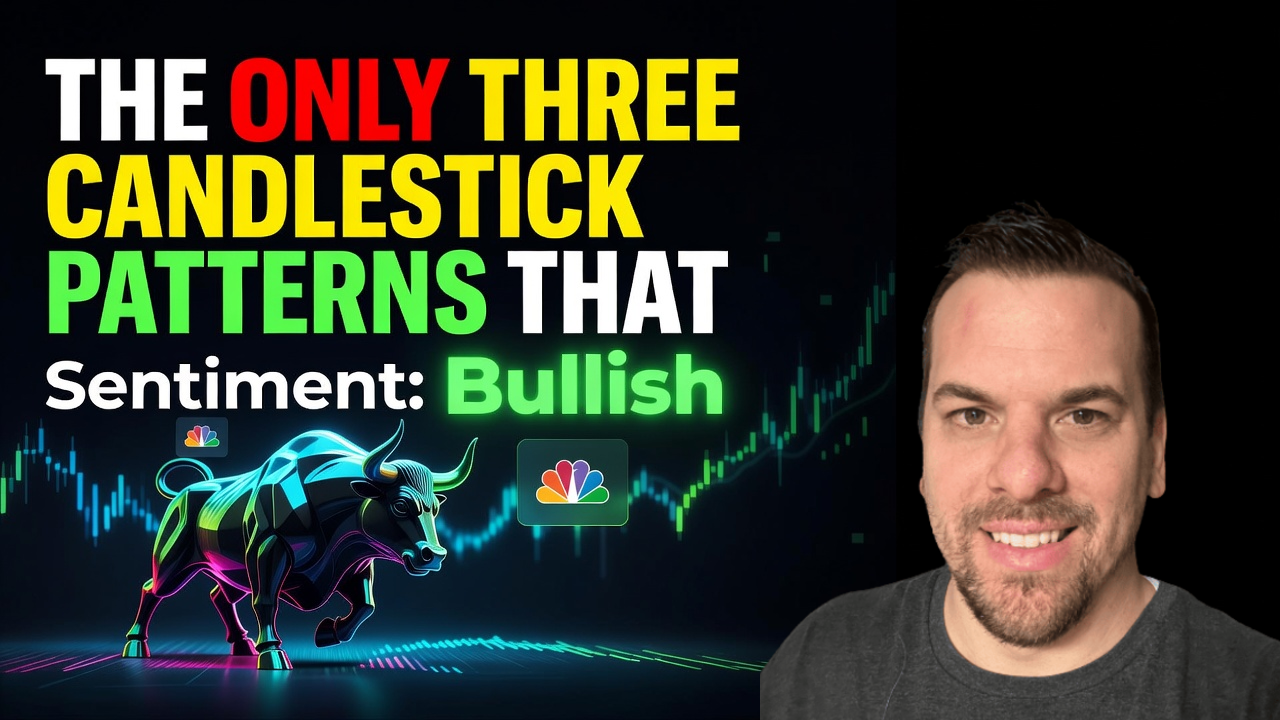
The Only Three Candlestick Patterns That Actually Matter

📊 July 31, 2026
- Ninety percent of named candlestick patterns are pure noise that will bleed your account dry.
- Retail traders lose money because they trade isolated candle shapes while completely ignoring market structure.
- Focus exclusively on pin bars, engulfing candles, and inside bars at high-timeframe key levels.
— Ben, Find Better Trades
If you have a cheat sheet with forty different Japanese candlestick patterns taped next to your monitor, burn it right now. Trading textbook patterns like the Three White Soldiers or a Morning Doji Star in isolation is a guaranteed way to hand your capital to institutional algorithms. Market structure drives price, and only three candlestick signals provide actionable structural information.
Why Everyone Gets This Wrong
Most retail traders view candlestick charts like a secret code where every single bar holds a magical prediction. They spot a hammer candle in the middle of a choppy sideways range and immediately slam the buy button. Two candles later, price sweeps right through their stop loss because they ignored the larger trend and surrounding market context.
Candlesticks do not drive the market; order flow and liquidity do. A single candlestick is simply a visual summary of open, high, low, and close prices over a specific timeframe. When you trade an abandoned baby or a dark cloud cover pattern on a five-minute chart without context, you are trading random financial noise.
Imagine price drifting down toward a minor mid-range level on low volume. A classic inverted hammer forms, and retail traders rush in long thinking a reversal is guaranteed. But because this pattern formed right underneath a heavy daily resistance zone without sweeping key liquidity, institutional sellers step in and smash price down another two percent within minutes.
Institutions spend millions to run liquidity raids specifically around these obvious textbook patterns. They know retail traders place buy stops right above a bullish harami or sell stops beneath a spinning top. Unless a candlestick pattern represents a distinct structural rejection or momentum shift at a key level, it is completely useless.
What Actually Works
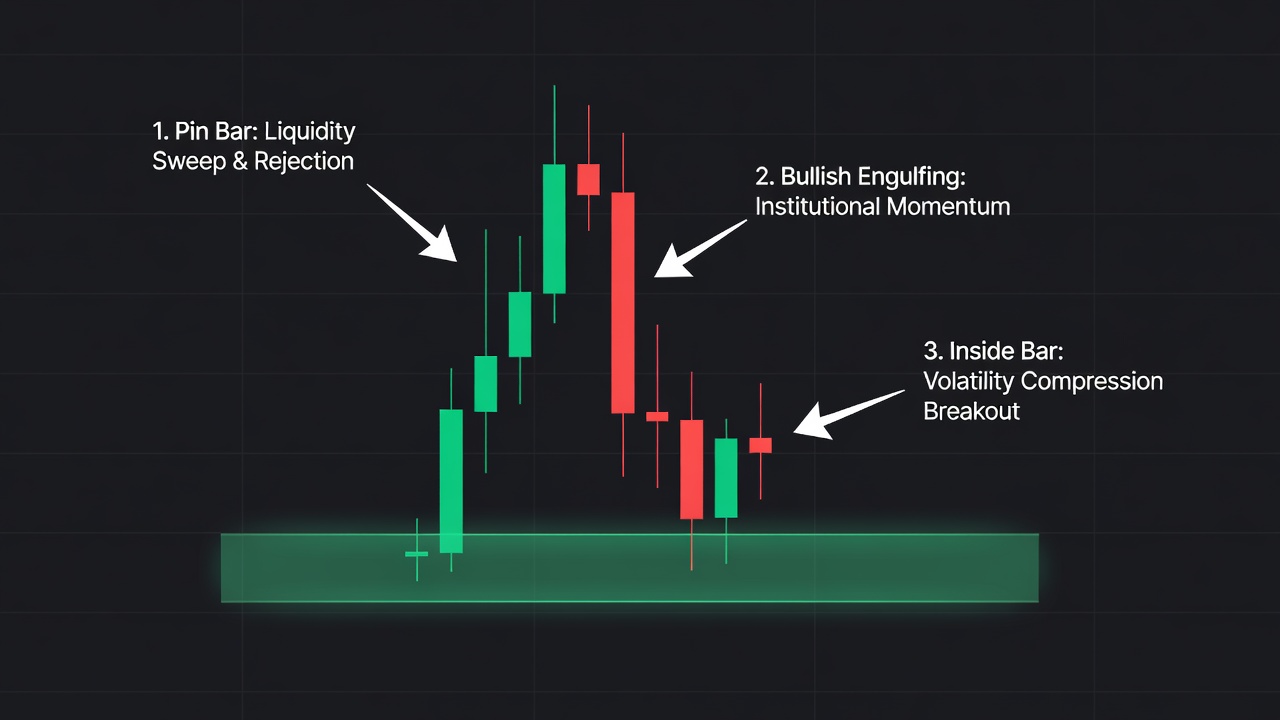
You only need three candlestick structures to make high-probability trading decisions: the pin bar, the engulfing candle, and the inside bar. Everything else is just a lower-quality variation of these three fundamental price behaviors. However, these patterns only work when they align directly with established support, resistance, or market structure.
The pin bar represents aggressive price rejection and liquidity sweeps. When price probes below a major support zone, triggers retail stop losses, and aggressively closes back inside the range leaving a long tail wick, smart money just swept liquidity. You trade the direction of the rejection wick, but strictly when it occurs at major structural boundaries.
The engulfing candle shows a decisive shift in market control and aggressive institutional order flow. A valid bullish engulfing candle must completely cover the body of the previous candle while pushing out of a consolidated key level. This signals that aggressive buyers have completely overwhelmed resting sell orders and are driving price into new territory.
The inside bar signals volatility compression right before an explosive expansion. It represents a brief pause where buyers and sellers reach temporary equilibrium before one side takes full control. When an inside bar forms right against a key breakout level, trading the high or low break gives you tight risk and maximum asymmetric reward.
By limiting your chart analysis to these three concrete setups, you eliminate technical paralysis and focus entirely on execution. You stop guessing what forty different Japanese terms mean and start reading real supply and demand shifts.
When Candlestick Patterns Can Still Help
Candlestick patterns are useful execution triggers, but only after your high-timeframe macro bias and key levels are already established. Think of a candlestick pattern as the final pull of the trigger, never the reason you pointed the gun in the first place.
When you combine a clean rejection pin bar at a daily key level with clear market structure, your entry precision increases dramatically. Use these three candles exclusively to refine your entries and tighten your stop placement, never to generate a standalone trade idea out of thin air.
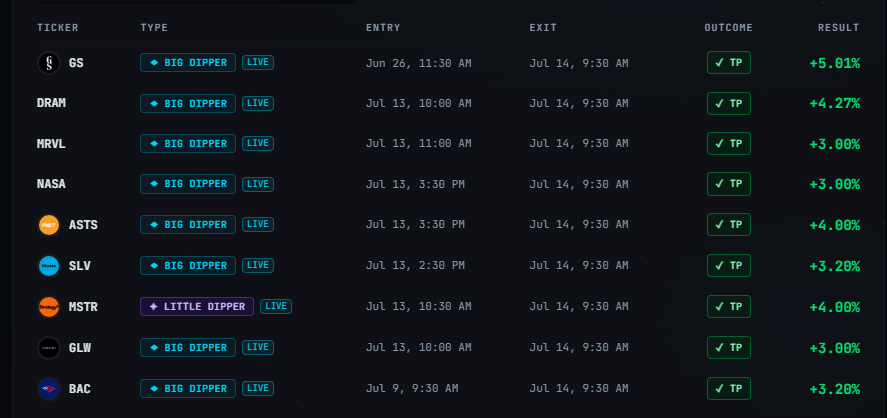
🎯 Want Setups Like These? The Big Dipper Does the Scanning For You.
Every morning the Big Dipper delivers curated DIP ZONE trade ideas — stocks already at high-probability entry levels, with targets pre-set. No guessing, no scanning. Just setups.

Candlestick Pattern FAQ
Q: What is the single most reliable candlestick pattern for day trading?
A: The single most reliable pattern is the pin bar, but only when it sweeps a key high or low during high-volume market hours. A pin bar floating in the middle of a consolidated range has zero predictive value.
Q: Should I trade candlestick patterns on lower timeframes like the 1-minute chart?
A: Lower timeframes contain massive amounts of market noise and institutional algorithm manipulation. Stick to the 1-hour, 4-hour, and daily charts to identify valid structural candlestick patterns that actually move real capital.
Free For Traders
Know What To Trade BEFORE The Opening Bell
The Big Dipper Dashboard hands you curated high-probability setups every single morning — free.

From Find Better Trades
The Pullback Isn’t A Warning. It’s Your Entry.
Slingshot catches the exact moment a trend pause is ready to rip back in your favor — built for explosive pullback continuations.

📈 Want More? Join Our Free Trading Community
- Trading Strategy Guides Telegram — daily strategy tips and market insights
- Find Better Trades Telegram — free trade signals delivered to your phone
- Find Better Trades on YouTube — live trade breakdowns and tutorials