Stop Chasing Wicks: Why Open and Close Crush Highs and Lows


📊 September 20, 2026
- Candle bodies show where real money committed, while extreme wicks are almost pure predatory noise.
- Most retail traders build their entire support and resistance playbook around extreme highs and lows, handing free liquidity to market makers.
- Base your key levels on candle opens and closes, and refuse to acknowledge a breakout until a session body settles outside the zone.
— Ben, Find Better Trades
Retail charting platforms teach you to obsess over the exact high and low of every single candle. It is the easiest way to turn your trading account into exit liquidity for an institutional desk.
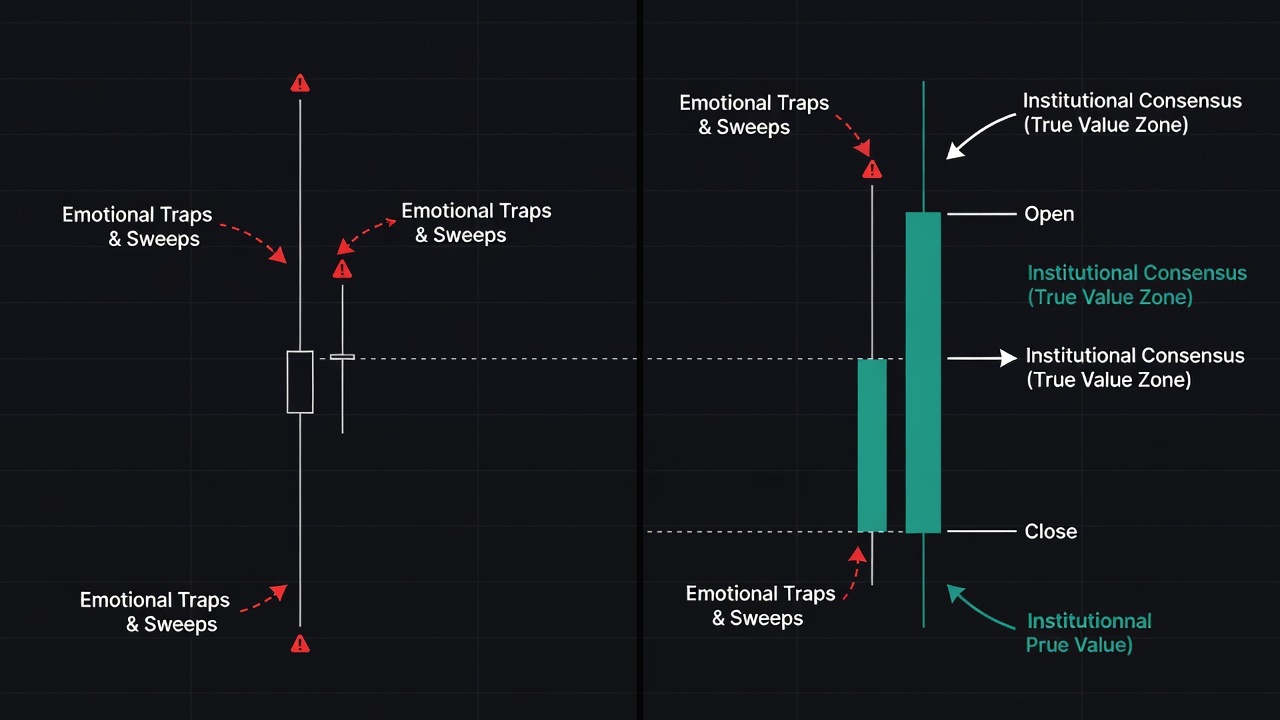
The extreme high and low of a candle represent nothing more than price discovery pushed to temporary exhaustion by market orders and trapped stops. The open and close tell you where capital actually agreed to sit down, stay, and defend value.
Why Everyone Gets This Wrong
Amateur traders anchor their horizontal levels to extreme wicks because an isolated high or low looks neat and decisive on a retrospective chart. You pull up a daily timeframe, spot a massive needle-thin spike from three weeks ago, and draw a hard line at the very tip.
When price returns to that wick extreme heading into a new week, you try to play the breakout or short the exact reversal. Then an algorithm sweeps two ticks past that high, trips a cluster of retail stop-losses, and violently snaps back inside the range.
That extreme wick was never a zone of real transactional consensus. It was a momentary liquidity vacuum where passive limit orders thinned out and aggressive market orders spiked price until one big participant stepped in and absorbed the move.
By treating that thin wick high as major resistance, you are treating an accident of microsecond market mechanics as deliberate institutional planning. The real battlefield was thirty pips lower, where the session opened, consolidated, and finally closed.
When a session prints a massive range with long wicks on both sides, the highs and lows tell you where the herd panicked and got liquidated. The candle body reveals who actually won the war before the bell rang.
If a market rallies ten dollars off the morning bell only to close flat right where it opened, bulls did not achieve anything of value. They burned their balance sheets pushing price into thin air, and smart money dumped into their bid before the session settled.
What Actually Works
Shift your eyes away from the needle points and rebuild your chart framework entirely around candle bodies. When you identify key horizontal support or resistance, anchor your boxes to the highest and lowest daily closes rather than the wick tips.
Treat the area between the candle close and the wick extreme as an acceptance test zone, not a boundary of genuine structure. If price pushes past a prior swing high during the session but fails to close above it, that is an auction failure, not a breakout.
When markets open tomorrow, watch how price interacts with Friday’s close instead of obsessing over Friday’s intraday high. A strong auction holds ground above the prior close because institutional buyers are willing to carry inventory overnight at that price point.
If you trade intraday timeframes heading into Monday, use the open of the session as your bias baseline. Trading long while price sits below the session open means you are fighting the prevailing institutional order flow of the day, no matter how shiny the five-minute high looks.
Wait for candle close confirmation before executing breakout trades. Forcing yourself to wait until the session body finishes outside a structural level instantly eliminates half of the false-breakout traps that butcher breakout traders.
You will miss the first few ticks of a move by waiting for the close, and you should celebrate that. You are paying a tiny entry tax in exchange for verifying that real institutional volume backed the move instead of a fleeting algo-driven sweep.
When Highs and Lows Can Still Help
Highs and lows are not completely useless, but their job is radically different from what retail textbooks claim. You do not use them as structural boundaries; you use them as targeted liquidity pools.
When a market prints an obvious, equal-high double top with clean wicks, you should expect that level to get raided before the real directional move begins. Use wick extremes to identify where retail stops are pooled, anticipate the sweep, and look for body closes back inside the structure to trigger your counter-move.
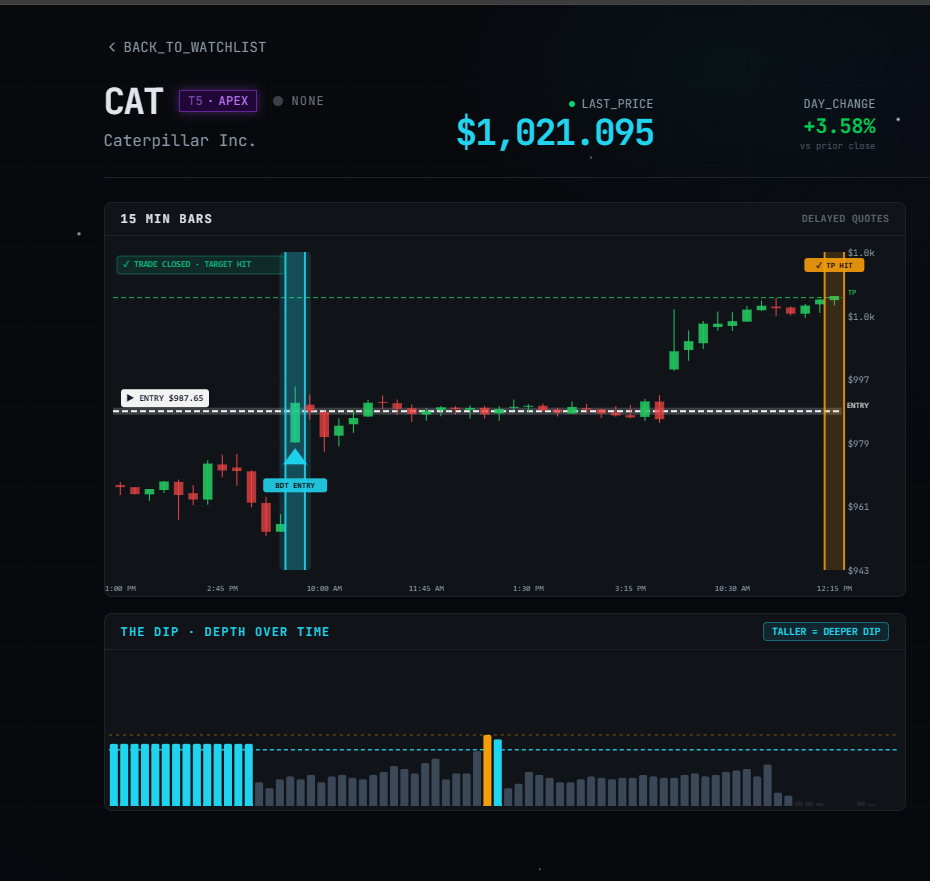
🎯 Want Setups Like These? The Big Dipper Does the Scanning For You.
Every morning the Big Dipper delivers curated DIP ZONE trade ideas — stocks already at high-probability entry levels, with targets pre-set. No guessing, no scanning. Just setups.

Candlestick Body and Wick FAQ
Q: Should I completely remove candle wicks from my charts?
A: No, leave the wicks visible so you can see where liquidity sweeps occurred, but draw your support and resistance zones strictly around the candle opens and closes.
Q: Does waiting for a candle close hurt your risk-to-reward ratio on entries?
A: It slightly widens your stop distance, but your win rate improves dramatically because you stop entering false intraday sweeps that immediately reverse against you.
Free For Traders
Know The EXACT Moment A Stock Hits Support Or Resistance
Real-time alerts fire the instant a stock approaches a critical level. Completely free.

From Find Better Trades
High-Win-Rate Patterns, Spotted In Real Time
Automated pattern recognition for reversals and continuations — no manual drawing, no missed setups.

📈 Want More? Join Our Free Trading Community
- Trading Strategy Guides Telegram — daily strategy tips and market insights
- Find Better Trades Telegram — free trade signals delivered to your phone
- Find Better Trades on YouTube — live trade breakdowns and tutorials