
The One Price Action Signal That Beats Every Indicator Combination

📊 August 5, 2026
- A failed breakout liquidity sweep beats every multi-indicator setup because it exposes live institutional order flow in real time.
- Stacking MACD, RSI, and moving averages creates severe execution lag and blinds you to where retail traders are actively getting trapped.
- Ditch cluttered chart templates, locate high-timeframe liquidity pools, and trade the violent rejection when smart money sweeps those orders.
— Ben, Find Better Trades
Stop cluttering your trading screens with four different lagging indicators expecting them to magically agree on a bias. If you need an RSI divergence, a MACD crossover, and a moving average touch to align before taking a position, you are getting into trades late every single time. The single most profitable price action signal in trading is the failed breakout liquidity sweep, and it leaves complex indicator stacks in the dust.
Why Everyone Gets This Wrong
Retail traders spend years looking for a holy-grail indicator template because they want an automated mathematical formula to remove human discretion. They overlay three or four lagging oscillators onto their charts, believing that overlapping mathematical equations somehow equal confirmation. In reality, every indicator is derived from historical price action, meaning adding extra indicators only adds extra lag to your execution.
Consider a market grinding directly into a major daily resistance level while retail traders watch their MACD print a bullish crossover and RSI push past 60. To the indicator trader, every signal is green, so they market-buy right at the resistance line and place their stop loss right below structure. But institutional traders do not trade indicator crossovers; they look for concentrated liquidity pools where thousands of predictable retail stop orders sit waiting.
When price pops above resistance, retail breakout traders buy aggressively, providing the exact counterparty volume institutional sell orders require. Smart money absorbs that retail buying, stalls the push, and aggressively drives price right back down into the previous trading range. The breakout fails, triggering an avalanche of retail stop losses, while lagging indicator traders are left holding the bag as their oscillators slowly turn downward minutes after the crash.
What Actually Works
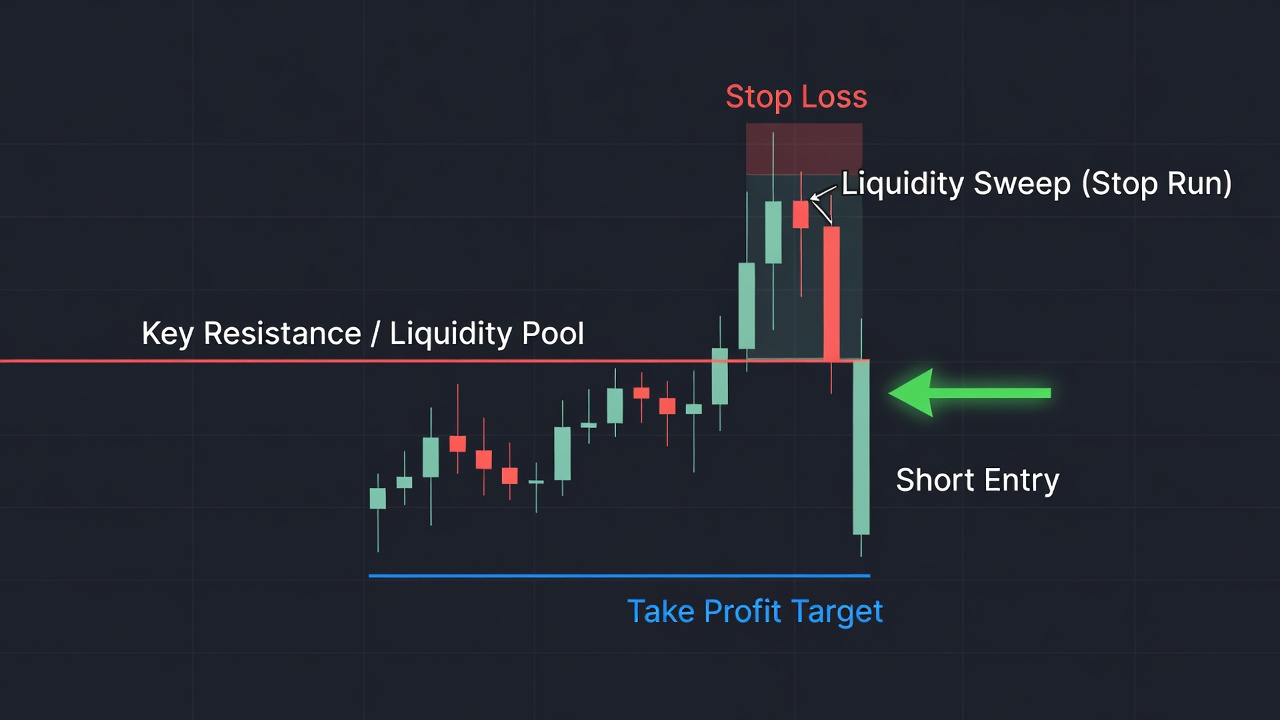
Instead of relying on lagging mathematical derivatives, you must trade the exact moment retail market participants get trapped on the wrong side of key levels. The failed breakout liquidity sweep is the purest footprint of institutional order flow available on a raw chart. It occurs when price briefly breaches a well-defined swing high or low, captures the stop orders sitting beyond structure, and violently reverses back inside the established range.
To execute this strategy, mark clean daily or four-hour swing highs and swing lows where obvious liquidity is pooled. When price breaks beyond one of these key levels, resist the urge to buy the breakout or wait for an oscillator to validate momentum. Instead, wait for a lower-timeframe candle to close firmly back inside the previous structure, leaving behind a long, prominent wick poking outside the range.
Your entry triggers the moment that rejection candle closes back inside key structure, with your stop loss anchored just beyond the extreme high of the wick. Because you enter right where institutional capital trapped breakout traders, your risk-to-reward ratio instantly outperforms any standard indicator model. You are no longer buying momentum three bars late; you are entering alongside the big players who just wiped out retail stops.
When Moving Averages Can Still Help
I am not arguing that every single technical tool outside of raw price bars is completely useless, but you must understand their actual purpose. A single higher-timeframe moving average can serve as an effective directional filter to keep you from fighting macro momentum. Using a 50-period EMA to define macro bias prevents you from shorting bullish liquidity sweeps during a strong uptrend.
Keep in mind that the moving average is strictly a background context tool, never your entry signal. The trigger must always be the price rejection candle itself taking place at a key structural level where liquidity was just swept.
🎯 Want Setups Like These? The Big Dipper Does the Scanning For You.
Every morning the Big Dipper delivers curated DIP ZONE trade ideas — stocks already at high-probability entry levels, with targets pre-set. No guessing, no scanning. Just setups.


Failed Breakout Price Action FAQ
Q: Why is a failed breakout rejection superior to an indicator crossover?
A: A failed breakout captures live institutional order flow and retail traps instantly, whereas indicator crossovers rely on averaged past price data that triggers long after the move has begun.
Q: What chart timeframes work best for trading liquidity sweep rejections?
A: The signal is most reliable on the 1-hour, 4-hour, and daily timeframes where major swing points hold significant institutional liquidity interest.
Free For Traders
One Clear Arrow. Every High-Probability Setup. Free.
The Fusion Indicator combines multiple signals into a single buy/sell arrow on TradingView so you never miss a move.

From Find Better Trades
Know Exactly Where The Big Money Steps In
Auto-plots institutional support & resistance zones from pure price action — no more guessing at levels.

📈 Want More? Join Our Free Trading Community
- Trading Strategy Guides Telegram — daily strategy tips and market insights
- Find Better Trades Telegram — free trade signals delivered to your phone
- Find Better Trades on YouTube — live trade breakdowns and tutorials


