
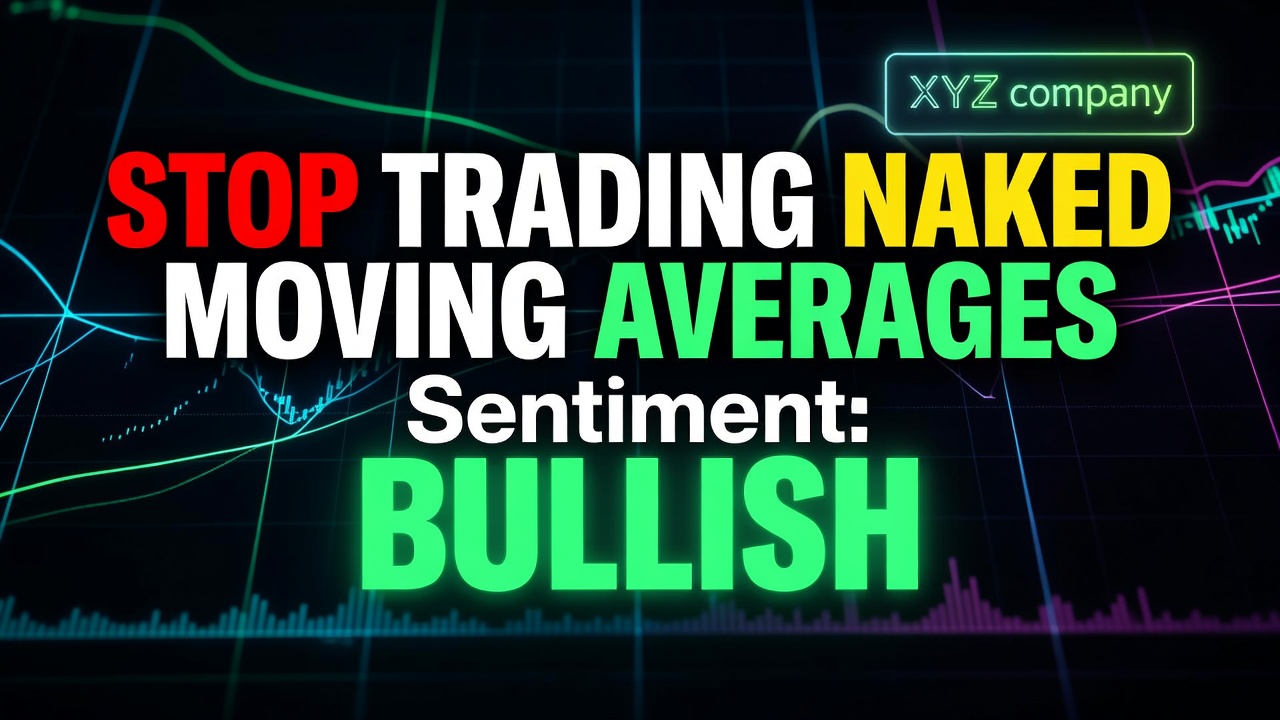
Stop Trading Naked Moving Averages: Confluence Is Your Only Edge

📊 August 8, 2026
- A floating moving average without horizontal support is an account killer.
- Retail traders keep buying naked indicator lines floating in dead space and wonder why their stops get systematically hunted.
- Heading into next week, look only for entries where dynamic moving averages directly intersect structural horizontal key support.
— Ben, Find Better Trades
Stop buying standard moving average pullbacks in a total vacuum. A floating line on your chart is not a trade setup, and treating it like one is why retail accounts bleed capital during routine pullbacks.
The cleanest, highest-probability entries on your chart occur when dynamic moving averages align directly with horizontal structural support. If you do not have both, you are taking unnecessary risk.
Why Everyone Gets This Wrong
Retail traders love dynamic indicators because they look clean and feel effortless. You slap a 20-period or 50-period exponential moving average on your chart, watch price drift down to touch the line, and impulsively click buy.
The fundamental flaw is that a moving average is merely smoothed historical price data that shifts with every tick. It possesses zero structural memory of actual supply and demand order blocks where real institutional capital sits.
When price strikes a lone 50 EMA floating in dead air, there is no structural reason for big money to defend it. You end up buying a brief pause in a deeper liquidation, only to watch price slice directly through your tight stop.
I see traders repeat this mistake every week. They assume that because an indicator line exists on their screen, the market is somehow obligated to respect it. That is pure fantasy.
Imagine a stock surging upward after a momentum breakout. Price eventually pulls back to hit its 20 EMA, but that moving average line is suspended far above any prior consolidation shelf or previous high.
Amateurs jump in immediately, setting tight stops right beneath the moving average line. Institutional algorithms effortlessly flush those stops, driving price down to the real horizontal price floor before launching higher without them.
What Actually Works
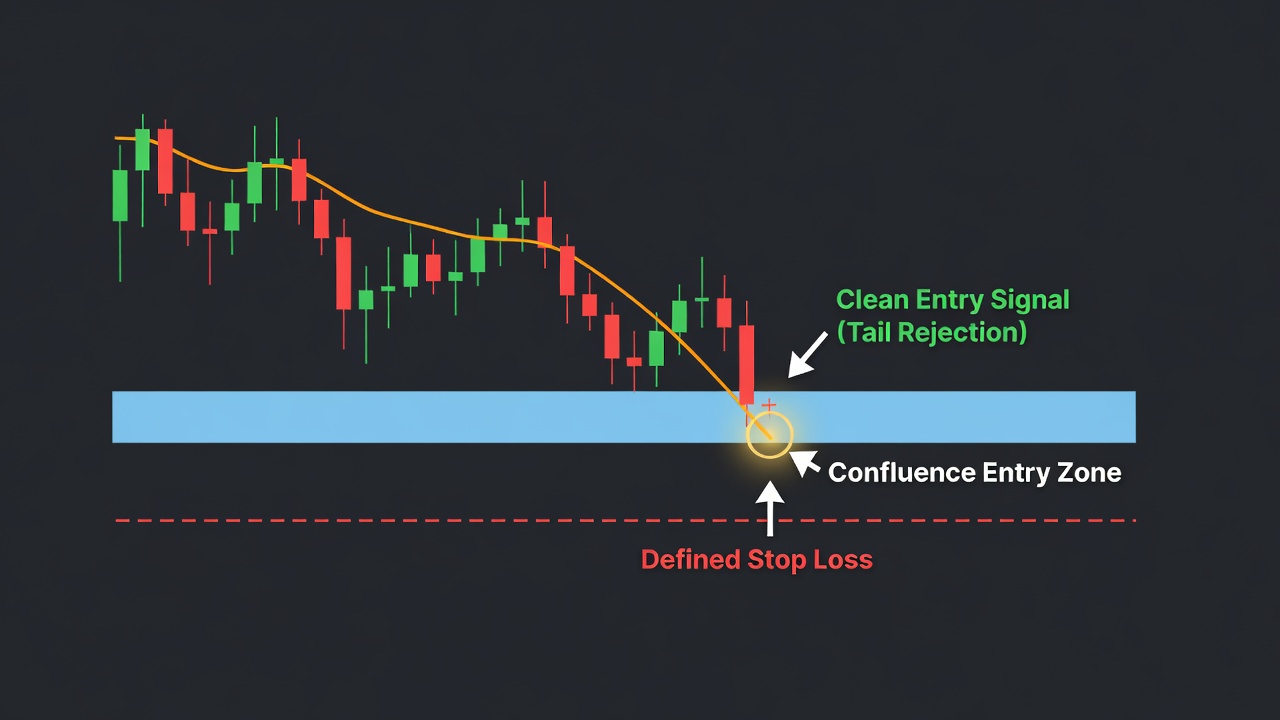
If you want to catch high-reward entries with minimal drawdowns, you must trade confluence. Confluence occurs when two completely independent technical factors intersect at the exact same price zone.
Specifically, you want a dynamic indicator line like the 20 EMA or 50 SMA intersecting a clear horizontal support level. This dual alignment drastically changes the market dynamics.
Horizontal support represents real historical memory where institutional buyers previously absorbed heavy selling volume. When a curving moving average meets that rigid price floor, dynamic momentum and structural order flow merge.
When you spot this multi-layered wall forming, your execution becomes objective and mechanical. Instead of guessing whether an indicator line will hold, you wait for price to test the merged zone.
When markets open Monday, keep your focus on price action behavior right inside these high-confluence zones. Look for confirmation signals like long lower rejection wicks or clear bullish engulfing candles bouncing off the combined support level.
Your risk management becomes drastically simpler and tighter too. You place your protective stop-loss just below the horizontal structural floor rather than beneath a floating indicator line.
This structure gives your trade adequate room to navigate noise while keeping your overall dollar risk tight. You get maximum upside leverage with a clear, logical exit point if the setup fails.
When Moving Averages Can Still Help
I am not advocating that you purge moving averages from your trading layout entirely. They remain valuable visual tools for instantly gauging trend directional bias and baseline market velocity across higher timeframes.
They also perform exceptionally well during powerful, runaway trending moves where price rarely pulls all the way back to major structural floors. In those high-momentum phases, dynamic lines help you track the trend without overthinking.
However, you must treat moving averages as secondary filters rather than standalone entry triggers. When you pair a dynamic indicator line with an undeniable horizontal price shelf, your entry quality improves exponentially.
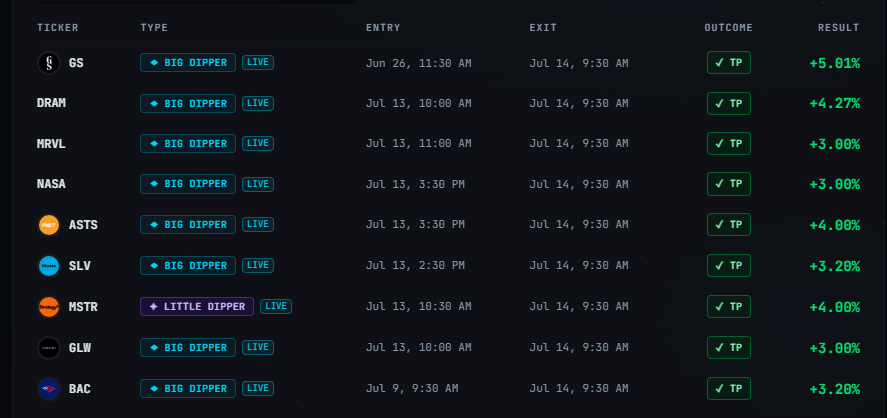
🎯 Want Setups Like These? The Big Dipper Does the Scanning For You.
Every morning the Big Dipper delivers curated DIP ZONE trade ideas — stocks already at high-probability entry levels, with targets pre-set. No guessing, no scanning. Just setups.

Moving Average Confluence FAQ
Q: Which moving average length works best with horizontal support levels?
A: The 20-period EMA and 50-period SMA provide the cleanest confluence setups on the daily and 4-hour charts. The exact length matters far less than ensuring the line intersects a strong, historical price shelf.
Q: What should I do if price breaks the moving average but holds horizontal support?
A: Horizontal support always takes priority over a moving average. If price dips through the indicator line but holds the horizontal level, the structural thesis stays valid and frequently creates a high-reward bear trap opportunity.
Free For Traders
One Clear Arrow. Every High-Probability Setup. Free.
The Fusion Indicator combines multiple signals into a single buy/sell arrow on TradingView so you never miss a move.

From Find Better Trades
Stop Scanning Charts. Let The Alerts Come To You.
Real-time Telegram alerts when stocks approach critical S&R levels across the whole market.

📈 Want More? Join Our Free Trading Community
- Trading Strategy Guides Telegram — daily strategy tips and market insights
- Find Better Trades Telegram — free trade signals delivered to your phone
- Find Better Trades on YouTube — live trade breakdowns and tutorials


