
Stop Trading MA Bounces: How to Layer Moving Averages With Structure

📊 August 14, 2026
- Moving averages are momentum filters and value gauges, never standalone support or resistance levels.
- Treating dynamic moving average touches as automatic buy or sell signals ignores underlying liquidity and market structure.
- Let price structure dictate your directional bias and trade triggers, using moving averages strictly to avoid chasing overextended moves.
— Ben, Find Better Trades
Most retail traders treat moving averages like magical trampoline lines on their charts. If you blindly buy every tap of the 20 EMA without checking market structure, you are actively donating your capital to institutional order flow.
Moving averages do not hold price up, and they never push price down. The sooner you strip away the indicator mysticism and layer them correctly over raw price structure, the faster your execution will improve.
Why Everyone Gets This Wrong
Retail trading tutorials love teaching moving average ribbons and dynamic bounces. They tell you to buy the moment price touches a rising 50 EMA, treating a trailing mathematical calculation like a solid concrete floor.
A moving average is purely a smoothing mechanism of past closing prices. It has zero awareness of unfilled limit orders, resting buy-side liquidity, or structural swing highs.
Consider a market that aggressively breaks below a key higher low, printing a clear market structure shift to the downside. A retail trader focused solely on indicators sees price pulling back into a rising 50-period line and hits buy, completely unaware that the trend’s structural backbone just snapped.
The market inevitably rolls over, slices through the moving average with zero hesitation, and triggers the trader’s stop loss. The moving average did not fail—the trader failed by expecting an indicator to overrule price action.
What Actually Works
My core rule is simple: price structure establishes your bias and triggers your trade; moving averages merely measure value. You must map swing highs, swing lows, and liquidity zones before you ever glance at an indicator.
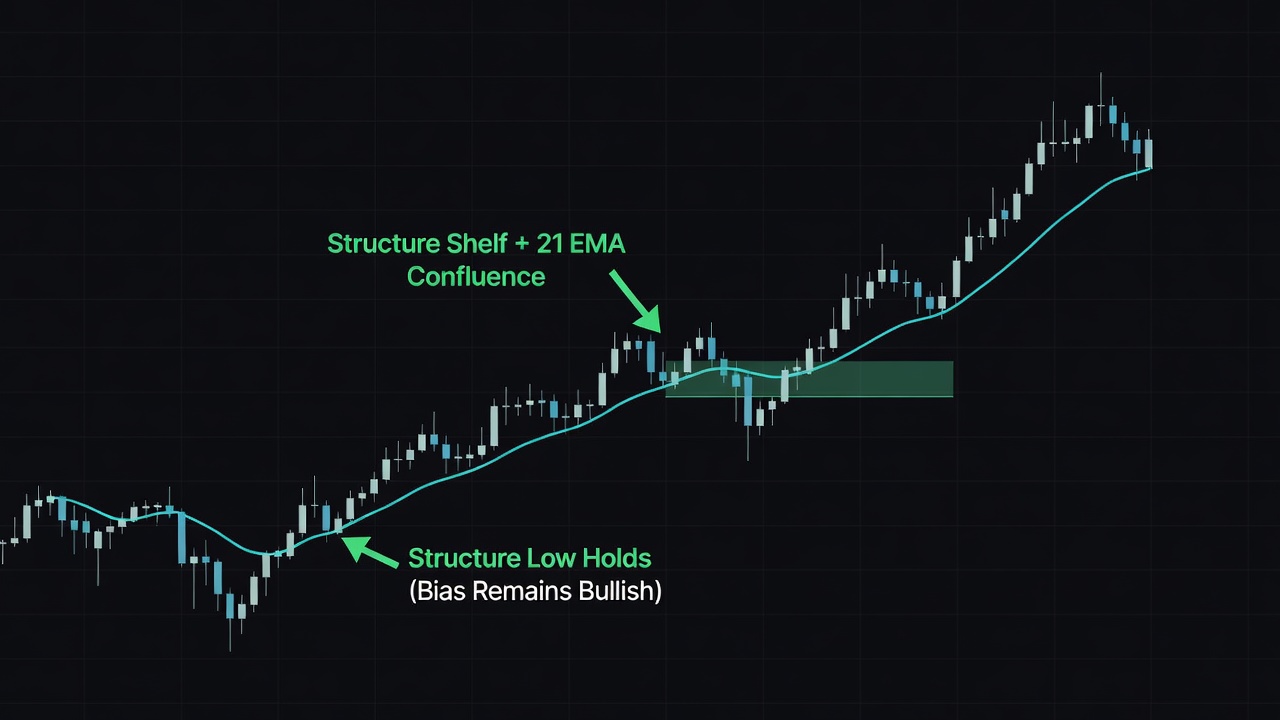
Use a single baseline, such as the 21 EMA, as a reference point for trend elasticity. When price is in a verified structural uptrend with higher highs and higher lows, you look for pullbacks that bring price back toward the 21 EMA area.
Crucially, you do not trigger an entry on the line touch itself. You wait for price to interact with a horizontal structural shelf—like a previous swing high retested as support—that happens to align near your moving average.
If price temporarily slices through your moving average but respects the major structural higher low, structure wins. You hold your long bias, wait for price to reclaim the structural level, and let the trailing average catch up naturally.
When Moving Averages Can Still Help
Moving averages excel as dynamic guardrails against bad trade location. They prevent you from chasing vertical breakouts when price is overextended far away from its mathematical mean.
If a breakout creates a massive impulse candle three times the distance from the 21 EMA, taking an entry there yields terrible risk-to-reward. The moving average acts as your visual reminder to wait for a healthy pullback toward structural value before committing risk.
🎯 Want Setups Like These? The Big Dipper Does the Scanning For You.
Every morning the Big Dipper delivers curated DIP ZONE trade ideas — stocks already at high-probability entry levels, with targets pre-set. No guessing, no scanning. Just setups.


Moving Averages and Price Structure FAQ
Q: Should I use EMAs or SMAs when pairing indicators with price structure?
A: Use exponential moving averages (such as the 21 EMA) because they weigh recent price movement heavier, providing a cleaner representation of short-term momentum without lagging behind recent structural swings.
Q: How many moving averages should I keep on my chart alongside structure?
A: Keep no more than two moving averages on your chart—one short-term trend filter like the 21 EMA and one macro baseline like the 200 SMA. Layering multiple moving average ribbons clutters your screen and distracts from key swing levels.
Free For Traders
The Options Cheat Sheet Thousands Of Traders Swear By
Calls, puts, spreads — one free download tells you the right options strategy for every market condition.

From Find Better Trades
Learn The Spread System From The Ground Up
Build, manage, and exit low-risk debit spreads for consistent income — full video course.

📈 Want More? Join Our Free Trading Community
- Trading Strategy Guides Telegram — daily strategy tips and market insights
- Find Better Trades Telegram — free trade signals delivered to your phone
- Find Better Trades on YouTube — live trade breakdowns and tutorials


