
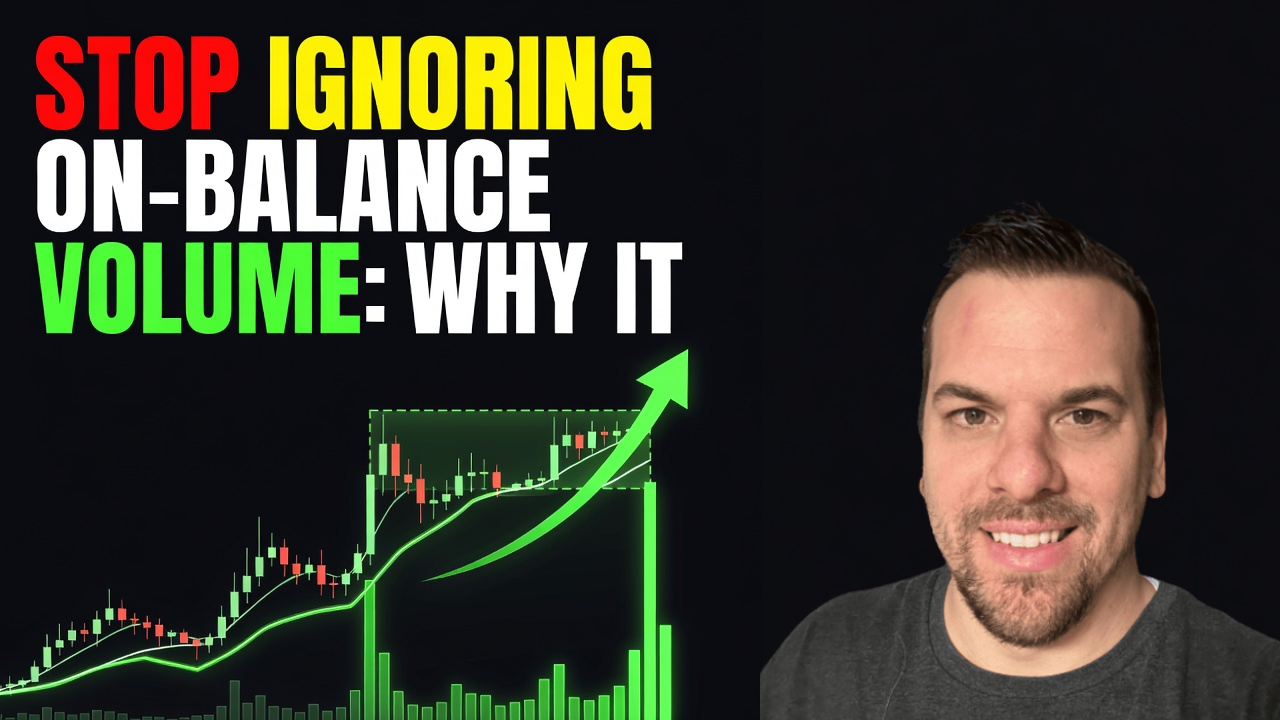
Stop Ignoring On-Balance Volume: Why It Destroys Modern Indicators

📊 September 23, 2026
- On-Balance Volume is the cleanest footprint of institutional accumulation on your screen, yet retail traders ditch it for shiny lagging oscillators.
- The fatal flaw is staring at raw volume histogram bars or treating OBV like an overbought/oversold oscillator rather than watching structural trendline breaks.
- Map support and resistance directly onto the OBV line to catch institutional absorption before price breaks out.
— Ben, Find Better Trades
Retail traders spend hours tweaking complex momentum algorithms, colored heatmaps, and proprietary volatility bands. Meanwhile, they write off On-Balance Volume because a running tally invented in 1963 feels too simple to work in modern markets. That blind spot is precisely why so many accounts bleed out chasing false breakouts.
Price can lie to you whenever market makers feel like running liquidity above a key level. Volume, however, is the actual fuel required to move the truck. When you ignore OBV, you are trading the shadow instead of the object casting it.
Why Everyone Gets This Wrong
The standard critique of OBV is that it is primitive. Critics point out that if an asset closes up by a single penny on the day, the entire day’s volume gets credited as positive. Because of this mechanical rule, amateurs assume the metric is too clumsy for today’s algorithmic environments.
So what do they do instead? They stare at the standard volume histogram bars at the bottom of their charts. That is completely useless because raw volume bars cannot show you cumulative pressure over time. A single spike tells you activity occurred, but it tells you nothing about whether institutions have spent the last six weeks soaking up floating supply.
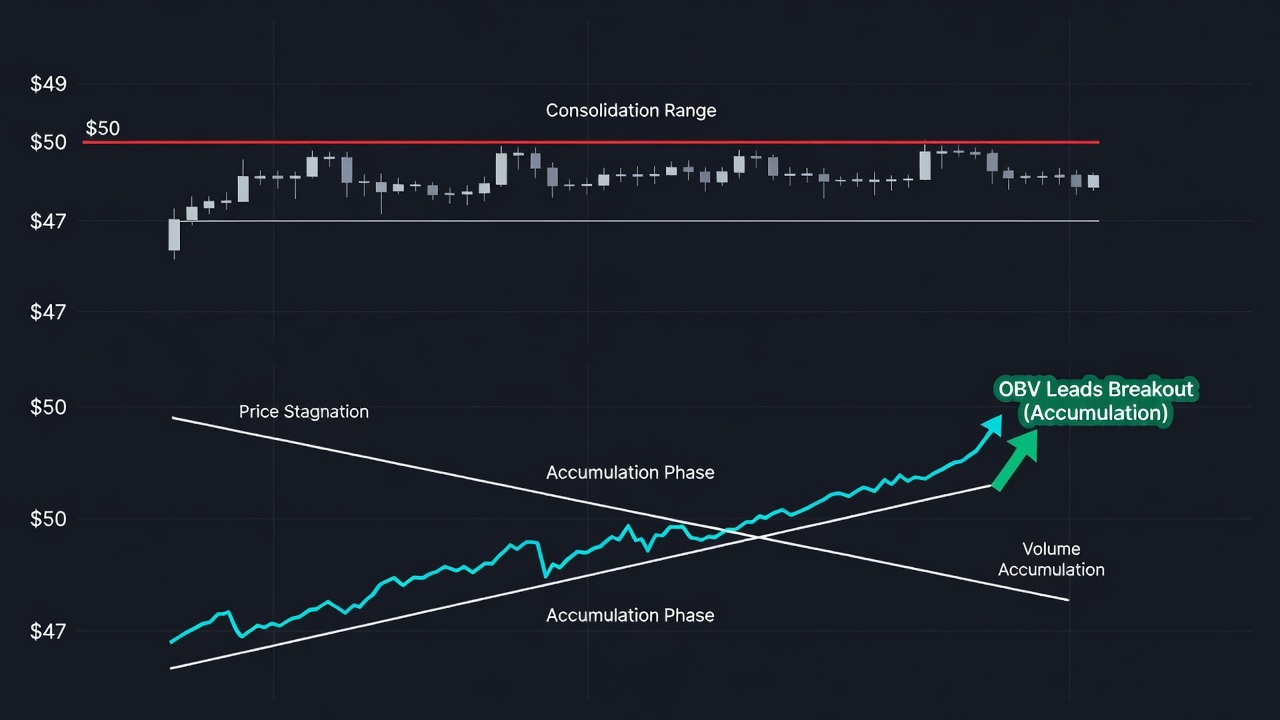
Here is the textbook trap I see traders fall into every single month. A stock trades in a tight four-week range right under heavy resistance at fifty dollars. The price action looks utterly boring, bouncing between forty-seven and forty-nine dollars with tight daily candles.
Most retail traders either ignore the setup or try to short the top of the range because momentum looks dead. Meanwhile, smart money is absorbing every single block of shares offered without letting the price climb. If you only look at price, you see stagnation, but if you look at the underlying flow, real inventory is vanishing from the float.
The other camp abuses OBV by treating it like an oscillator. They pull it up, look for arbitrary overbought readings that do not exist, and then abandon it when it fails to produce a standard mean-reversion signal. OBV is not a momentum gauge; it is a cumulative inventory ledger.
What Actually Works
Stop looking at the absolute numerical value of OBV. The raw number is completely arbitrary and depends solely on when your charting platform started calculating the data stream. What matters is the relative structure, the slope, and the structural pivots.
The first high-probability tactic is drawing structural trendlines directly on the OBV line. When price is grinding sideways or carving out lower highs inside a consolidation pattern, watch the OBV trendline. If OBV shatters its descending trendline while price remains pinned down, you have front-row seats to institutional accumulation.
Think about what that divergence actually means in the order book. Large players cannot enter massive positions all at once without blowing the spread out. They intentionally suppress price inside a consolidation zone while hoovering up shares on up-ticks. The OBV line surges forward because the up-day volume vastly outweighs the dry, low-volume drift on down-days.
By the time price finally prints a breakout candle past resistance, retail traders rush in late and chase the top. If you watched the OBV trendline snap two sessions earlier, you already took your entry near support with defined risk. You are selling into their late FOMO rather than joining it.
The inverse setup is just as deadly for catching bull traps. If price pushes to a pristine new swing high, but your OBV line stalls out well below its previous peak, walk away from the long trade immediately. That is pure distribution masquerading as momentum, and the rug pull is usually swift and vicious.
When On-Balance Volume Can Still Help
To be clear, OBV is not a magic crystal ball that solves every choppy tape. Its primary vulnerability comes from massive institutional rebalancing events, index inclusions, or quadruple-witching volume anomalies. A single freak day with twenty times the average volume can bend the indicator line so aggressively that it distorts the chart’s visual geometry for weeks.
When that distortion occurs, you cannot rely on clean slope angles until the data normalizes. But on liquid individual stocks and index ETFs trading through standard market cycles, OBV cuts through noise faster than almost anything else on your layout. It keeps you on the right side of institutional positioning when standard price action is intentionally designed to shake you out.
🎯 Want Setups Like These? The Big Dipper Does the Scanning For You.
Every morning the Big Dipper delivers curated DIP ZONE trade ideas — stocks already at high-probability entry levels, with targets pre-set. No guessing, no scanning. Just setups.


Frequently Asked Questions About On-Balance Volume
Q: Can I use On-Balance Volume for intraday trading on 5-minute charts?
A: Yes, but only when paired with key intraday session levels like VWAP and opening range boundaries. Intraday noise and algorithmic chop can create false spikes, so stick to trendline breaks on higher-liquidity tickers during peak volume hours.
Q: How do I handle an OBV chart that is skewed by a massive earnings volume spike?
A: Reset your visual frame by drawing your trendlines and support zones strictly from the post-earnings low or high forward. Treating the post-spike consolidation as a clean slate prevents the single-day outlier from muddying your directional bias.
Free For Traders
Get Free Weekly Trade Ideas Sent Straight To Your Phone
Join thousands of traders who get high-probability setups delivered every week — no cost, no catch.

From Find Better Trades
Know Exactly Where The Big Money Steps In
Auto-plots institutional support & resistance zones from pure price action — no more guessing at levels.

📈 Want More? Join Our Free Trading Community
- Trading Strategy Guides Telegram — daily strategy tips and market insights
- Find Better Trades Telegram — free trade signals delivered to your phone
- Find Better Trades on YouTube — live trade breakdowns and tutorials


