
Stop Chasing 5-Minute Levels: Why Higher Timeframe S&R Always Wins


📊 July 17, 2026
- Higher timeframe support and resistance levels are the only zones where institutional liquidity actually rests.
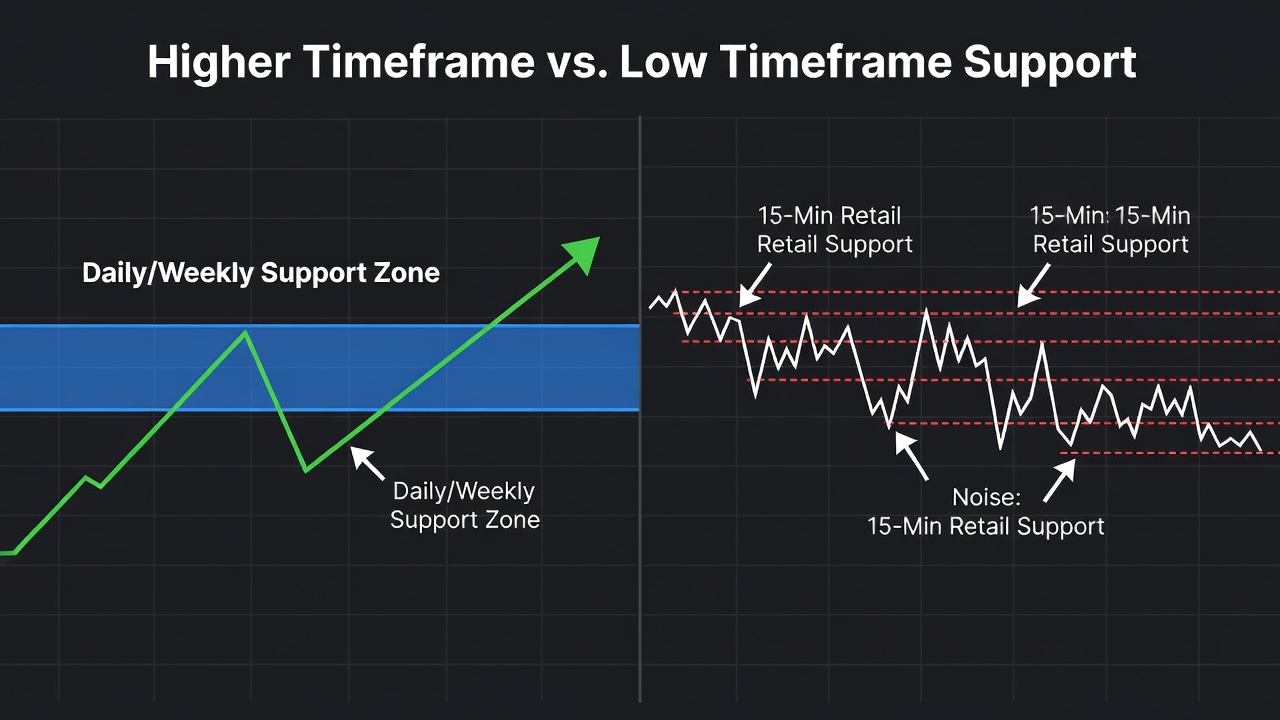
- Most retail traders lose because they treat noisy, low-timeframe intraday pivots with the same weight as weekly levels.
- Stop plotting dozens of lines on your 5-minute chart and map your zones exclusively from the daily and weekly charts first.
— Ben, Find Better Trades
If you are tired of watching your perfect support level get sliced through like butter two minutes after you entry, I have some bad news for you. You are probably looking at a chart that is zoomed in way too close. The hard truth is that the market does not care about the minor swing low you found on your 3-minute chart.
Retail traders love to clutter their screens with dozens of lines, hoping one of them magically catches the bounce. But if you want to trade with the smart money, you have to look at the levels they are actually defending. Higher timeframe support and resistance always wins because that is where the real institutional orders are sitting.
Why Everyone Gets This Wrong
The biggest trap in technical analysis is believing that support and resistance work the same way on every single timeframe. You have probably heard the gurus say that charts are fractal and what works on a daily chart works on a 1-minute chart. This is a lie that blows up accounts every single day.
Think about how a large hedge fund or commercial bank operates. They cannot deploy fifty million dollars of capital into a position using a 5-minute zone because there is simply not enough liquidity there. When they need to buy or sell, they look at major weekly and daily inflection points where they can match their massive orders with opposing retail liquidity.
When you trade a support level on a low timeframe, you are trading noise and retail order flow. A minor support level on a 15-minute chart might hold for an hour, but as soon as a daily order block is tapped, that tiny intraday level will be obliterated. You are essentially standing in front of a freight train trying to catch a baseball.
What Actually Works
To fix this, you must completely flip your top-down analysis on its head. Start your trading week by opening the weekly chart and marking only the most obvious, major swing highs and swing lows. Do not draw a line at every single candle wick; instead, shade in broad zones where price has historically paused and reversed violently.
Once you have those weekly zones, drop down to the daily chart and refine them slightly. These are your battlegrounds. If price is floating in the middle of nowhere between two major daily zones, you do not take a trade. You wait patiently for price to reach these high-value zones before you even think about looking for an entry trigger.
When price finally taps a daily or weekly zone, that is when you zoom in to a lower timeframe like the 1-hour or 15-minute chart. Now, you are not looking for new levels; you are looking for structural confirmation, like a shift in market structure or a failed breakout, inside that major higher timeframe zone. This simple shift ensures you are always trading in the direction of institutional flow.
When Low Timeframe S&R Can Still Help
Does this mean low timeframe levels are completely useless? Not entirely, but their role needs to be strictly defined. You should never use a 5-minute or 15-minute level as the catalyst for a swing trade or a major position.
Instead, use low timeframe levels strictly for trade management and taking partial profits. If you entered a trade off a daily support zone, you can target the next minor intraday resistance level to scale out of a portion of your position. This locks in gains while letting the rest of your trade run toward the next major higher timeframe target.
🎯 Want Setups Like These? The Big Dipper Does the Scanning For You.
Every morning the Big Dipper delivers curated DIP ZONE trade ideas — stocks already at high-probability entry levels, with targets pre-set. No guessing, no scanning. Just setups.


Frequently Asked Questions About S&R Timeframes
Q: Which timeframe is best for drawing support and resistance zones?
A: The daily and weekly charts are by far the most reliable timeframes for identifying major support and resistance zones that institutions actually respect.
Q: How do I know if a higher timeframe level will hold or break?
A: You do not guess; you wait for price to react to the zone on a lower timeframe, looking for a clear shift in market structure or a sweep of liquidity to confirm the bounce.
🎯 Get High-Probability Trade Setups — Free
The Big Dipper Dashboard delivers curated trade ideas straight to your screen every morning. Know what to watch before the opening bell.

📈 Want More? Join Our Free Trading Community
- Trading Strategy Guides Telegram — daily strategy tips and market insights
- Find Better Trades Telegram — free trade signals delivered to your phone
- Find Better Trades on YouTube — live trade breakdowns and tutorials


