
Stop Buying the 50 EMA: How Real Traders Trade Dynamic Support

📊 September 25, 2026
- The 50 EMA is not a concrete floor, and treating it like one turns your account into institutional exit liquidity.
- Retail traders place predictable stop losses right below the moving average line, making it the easiest stop-run target on the chart.
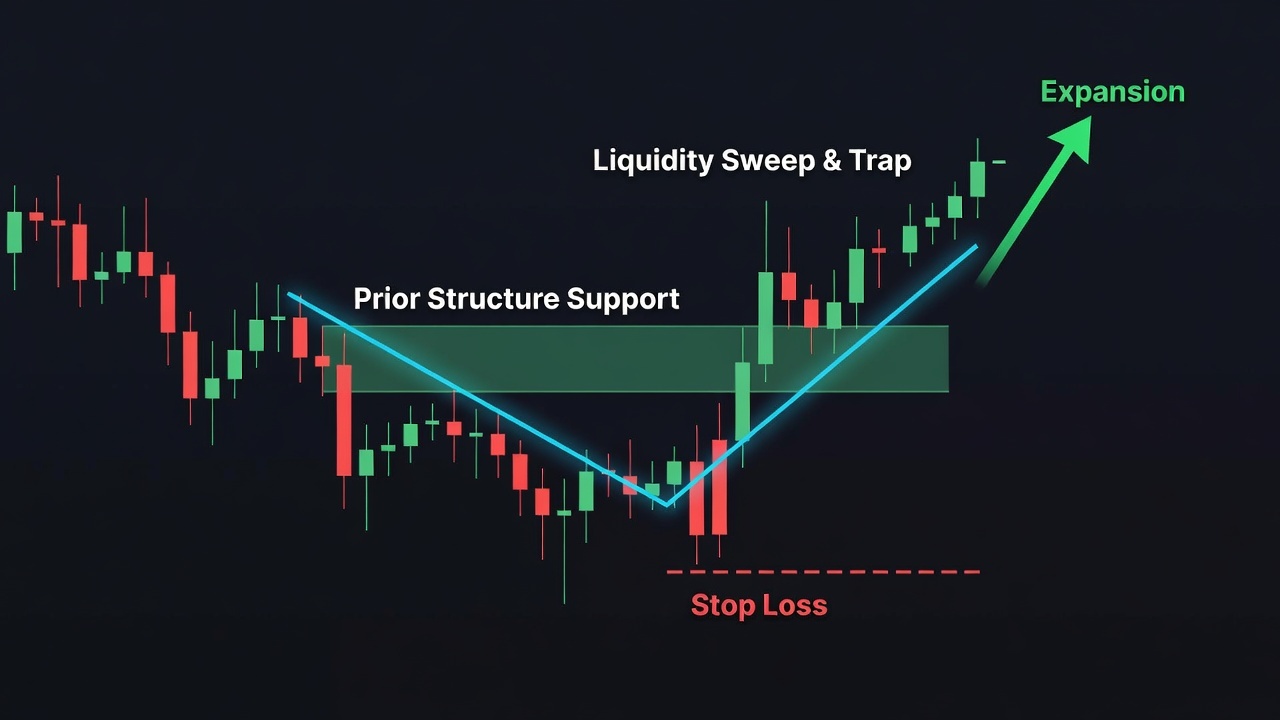
- Wait for price to sweep through the 50 EMA into prior horizontal structure, confirm seller absorption, and enter only after the trap springs.
— Ben, Find Better Trades
Most retail traders treat the 50 EMA like a sacred trampoline. You watch an uptrend pull back, drop a limit order directly on the line, tuck your stop-loss five ticks underneath, and wait to get rich. Then an algorithmic sweep wicked straight through your level, took your money, and ripped to new highs without you.
Why Everyone Gets This Wrong
Trading textbooks love to peddle the myth that moving averages act as mechanical support because buyers magically step in at the line. That flawed idea persists because it is easy to teach, but it completely ignores how institutional order flow operates in modern markets.
Consider what happens during a standard pullback in an established uptrend. Thousands of retail traders see the price drifting toward the rising 50 EMA and leave identical limit buy orders directly on the average. Right below that moving line sits a massive, dense cluster of sell-stop orders.
To an institutional algorithm that needs to fill hundreds of thousands of shares, that cluster of retail stops is pure fuel. The smart money does not defend the moving average line; they deliberately let price slice right through it to trigger your stops. That forced selling creates the exact liquidity injection large operators need to build their positions at a discount.
A moving average is nothing more than a trailing visual representation of past closing prices. Expecting a mathematical calculation on a screen to hold price up like a brick wall is financial suicide.
What Actually Works
Professional traders treat the 50 EMA as a general location of interest rather than an execution trigger. The goal is never to buy the touch of the line, but to watch how aggressive market participants react when price violates it.
Start by identifying an established horizontal support zone, such as a prior swing high or a consolidation shelf, that sits just below the rising 50 EMA. When price flushes through the moving average and taps that horizontal level, you get a clean structural alignment that retail traders completely ignore. You want the retail stop-run to happen directly into that underlying price shelf.
Next, wait for definitive proof of absorption before you risk a single dollar. Look for an aggressive intraday candle that probes below the 50 EMA and instantly leaves a long lower wick, followed by a strong close back above the average. That rejection proves the sellers who chased the breakdown are now trapped offside.
Once that trap is confirmed, place your stop well below the structural swing low of the sweep, never directly under the moving average. Your entry happens on the reclaimed close, positioning you alongside the players who engineered the stop run rather than the crowd that got swallowed by it.
When the 50 EMA Can Still Help
The 50 EMA still holds immense value on a chart, provided you respect what it actually measures. It serves as an exceptional benchmark for trend slope, showing you immediately whether an asset is maintaining healthy momentum or running out of steam.
It also gives you an objective visual reference for mean reversion. When an asset extends too far above a rising 50 EMA, chasing it is foolish; waiting for the spread between price and the average to compress gives you a far safer risk profile.
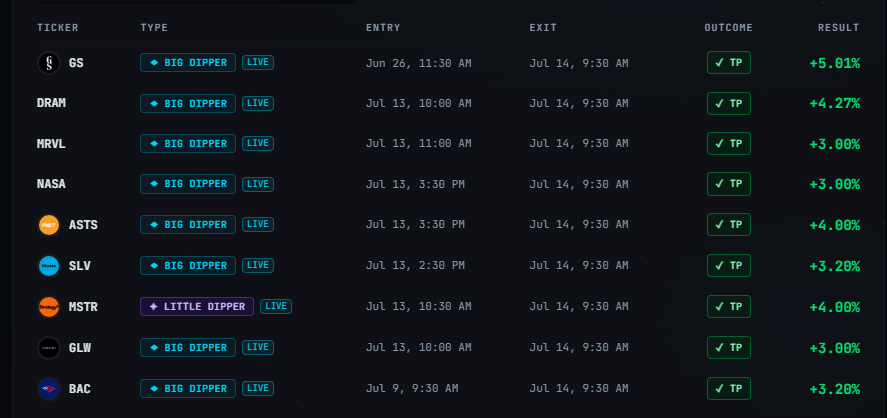
🎯 Want Setups Like These? The Big Dipper Does the Scanning For You.
Every morning the Big Dipper delivers curated DIP ZONE trade ideas — stocks already at high-probability entry levels, with targets pre-set. No guessing, no scanning. Just setups.

50 EMA Dynamic Support FAQ
Q: What timeframe works best for trading dynamic support on the 50 EMA?
A: The daily and 4-hour charts provide the most reliable structural reactions because institutional participants actively track those timeframes. Lower timeframes generate far too much market noise and produce frequent false breakdown traps that will bleed your capital.
Q: Is the 50 EMA better than the 50 SMA for trend trading?
A: The 50 EMA is significantly better for active trading because its weighting mechanism responds much faster to recent price shifts. The 50 SMA lags too far behind aggressive momentum moves, making your visual anchor stale during fast pullbacks.
Free For Traders
Learn How To Find Quality Options At A Discount
Get the free Discount Options playbook and selected Telegram alerts showing how strong stocks can create discounted call-option setups after temporary pullbacks.

From Find Better Trades
I Only Look For ONE Green Arrow. Here’s Why.
Coiled Spring PRO tracks institutional volume surges and extreme volatility compression — then prints a non-repainting arrow the exact moment a stock is ready to explode. No guessing. No repainting. One arrow.

📈 Want More? Join Our Free Trading Community
- Trading Strategy Guides Telegram — daily strategy tips and market insights
- Find Better Trades Telegram — free trade signals delivered to your phone
- Find Better Trades on YouTube — live trade breakdowns and tutorials


