
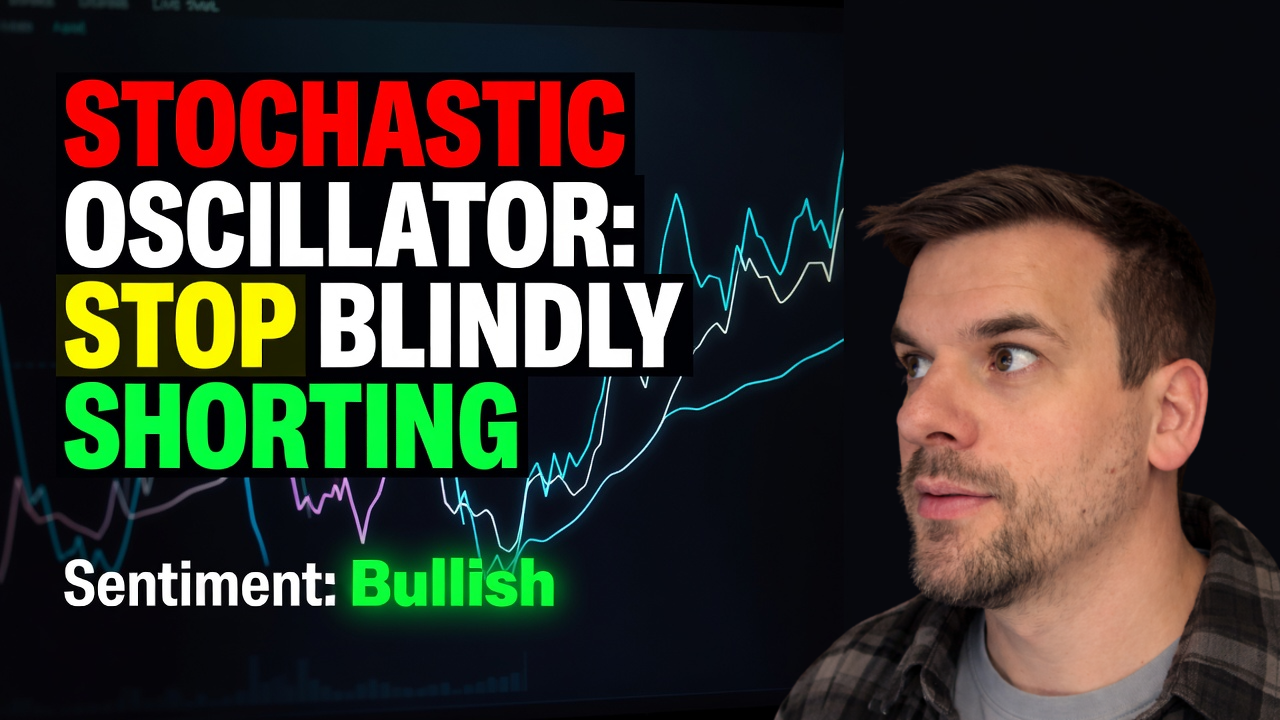
Stochastic Oscillator: Stop Blindly Shorting Overbought Markets

📊 August 23, 2026
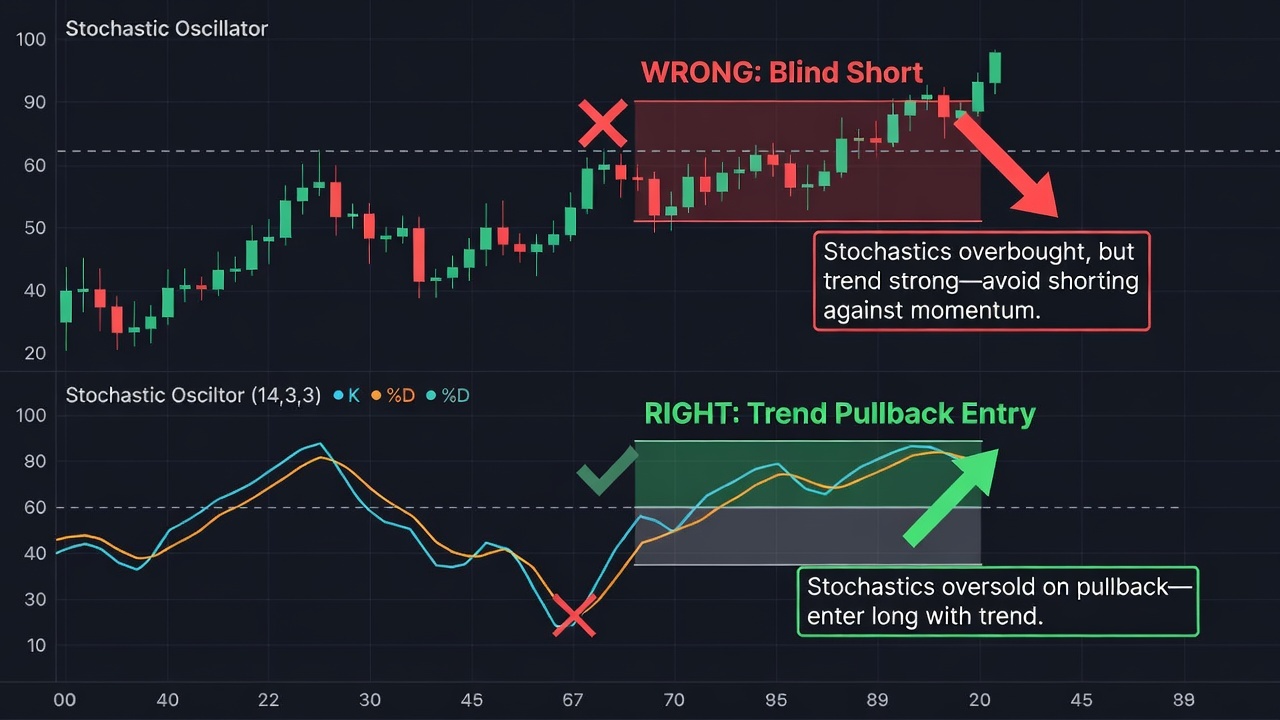
- The conventional rule of buying under 20 and selling over 80 is the fastest way to get steamrolled in a trending market.
- Overbought readings simply mean price is closing near the top of its recent range, which is a symptom of aggressive buying pressure rather than an imminent top.
- Use the indicator exclusively as a trend-pullback entry trigger or trade multi-touch divergences at confirmed structural levels.
— Ben, Find Better Trades
Most retail trading manuals teach one rule for the Stochastic Oscillator: buy when the lines cross below 20, and sell short when they cross above 80. If you trade like that, you are handing your capital straight to institutional momentum desks.
An oscillator pinned above 80 does not mean a market is about to crash. More often than not, it means you are standing in front of a runaway freight train.
Why Everyone Gets This Wrong
George Lane designed the Stochastic Oscillator to measure where a price closes relative to its high-low range over a given lookback period. When price consistently closes near the absolute high of the bar, the indicator mathematically must register readings of 85, 90, or even 95.
Retail traders look at an indicator hovering at 90 and assume the asset is overpriced and due for an immediate drop. They open short positions directly into the teeth of powerful institutional accumulation cycles.
Picture an asset breaking out of a multi-week base at $50 on heavy volume and pushing toward $62 over five trading sessions. By the third session, the Stochastic lines cross above 80, flashing an overbought signal. Traders who short that bearish crossover at $55 get squeezed out mercilessly as the asset runs to $65 while the indicator stays pegged near 90 the entire time.
Overbought does not mean bearish; overbought means extremely strong upside momentum. Treating high momentum as an automatic reversal signal is why so many retail traders blow their accounts trying to pick tops.
What Actually Works
To make this indicator work for you when markets open tomorrow, you must flip the conventional playbook upside down. Stop using Stochastics to pick turning points against the dominant trend, and start using them to time entries in the direction of that trend.
First, identify the primary trend on the daily chart using simple market structure or a 50-period moving average. When the broader trend is distinctly bullish, you completely ignore every single overbought signal and every bearish crossover above 80.
Instead, wait for price to pull back to an established support zone or rising moving average while the Stochastic drops into the 20 to 30 region. When the faster %K line crosses above the %D line inside or just above that lower band, you have a high-probability trigger to enter long in alignment with the macro momentum.
Second, if you want to trade counter-trend reversals, require a confirmed structural divergence across multiple swings. Price must print a clear higher high while the Stochastic prints a prominent lower high below the previous peak, followed by an actual market structure break on your execution chart.
Third, watch for embedded oscillator conditions where both lines stay above 80 for multiple consecutive candles. That behavior confirms a high-velocity momentum thrust, signaling that you should look to add to winning trend positions rather than exiting them.
When the Stochastic Oscillator Can Still Help
This indicator does have a legitimate place in your toolkit when market conditions match its mathematical design. In flat, range-bound environments where price bounces predictably between clear horizontal support and resistance, standard overbought and oversold boundaries provide clean execution boundaries.
It is also useful as a lower-timeframe entry trigger heading into Monday. Once your higher-timeframe thesis is locked in, letting an oversold Stochastic reading signal your precise entry gives you a defined invalidation point and tighter risk management.
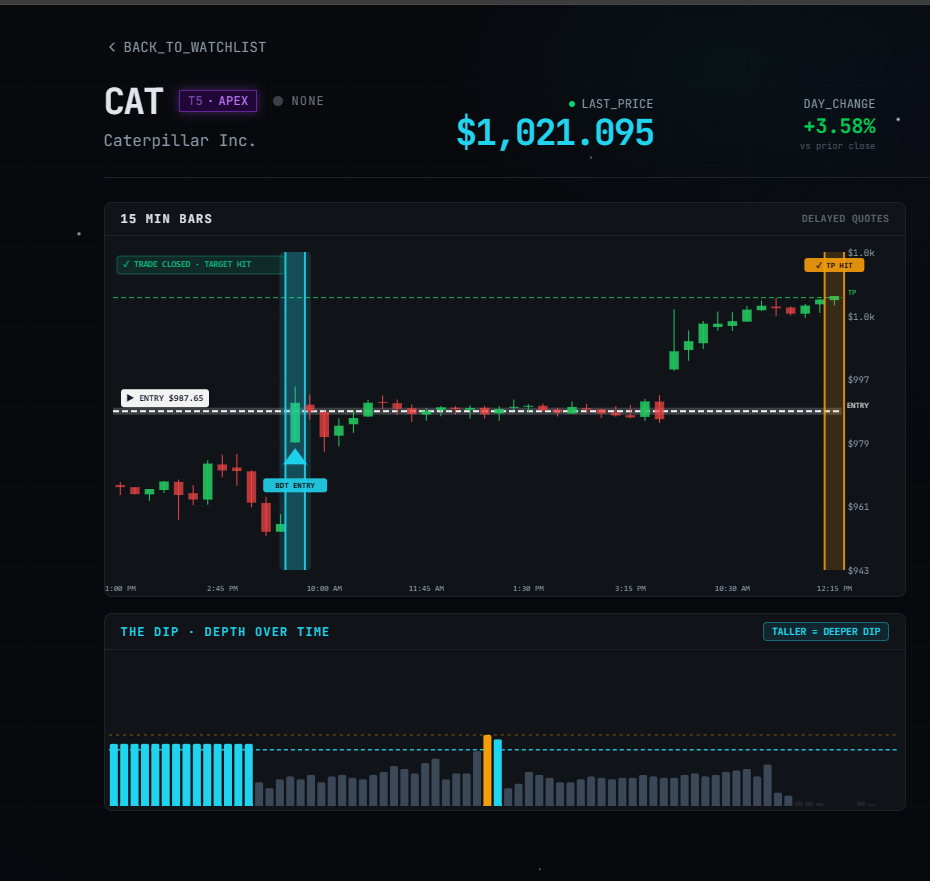
🎯 Want Setups Like These? The Big Dipper Does the Scanning For You.
Every morning the Big Dipper delivers curated DIP ZONE trade ideas — stocks already at high-probability entry levels, with targets pre-set. No guessing, no scanning. Just setups.

Stochastic Oscillator FAQ
Q: What are the best Stochastic Oscillator settings for swing trading?
A: The default (14, 3, 3) setting works well for catching fast pullbacks, but shifting to a slower (21, 5, 5) configuration smooths out whipsaws and produces cleaner entry signals on daily charts.
Q: Should I use RSI or the Stochastic Oscillator for trade entries?
A: RSI is better suited for gauging broad trend strength and macro divergence, while the Stochastic Oscillator is far more sensitive to short-term range extremes, making it the superior tool for timing precise pullback entries.
Free For Traders
One Clear Arrow. Every High-Probability Setup. Free.
The Fusion Indicator combines multiple signals into a single buy/sell arrow on TradingView so you never miss a move.

From Find Better Trades
Green Light Means GO. It’s That Simple.
Clear signals for directional options plays — momentum plus chain data tells you exactly which strike to buy.

📈 Want More? Join Our Free Trading Community
- Trading Strategy Guides Telegram — daily strategy tips and market insights
- Find Better Trades Telegram — free trade signals delivered to your phone
- Find Better Trades on YouTube — live trade breakdowns and tutorials


