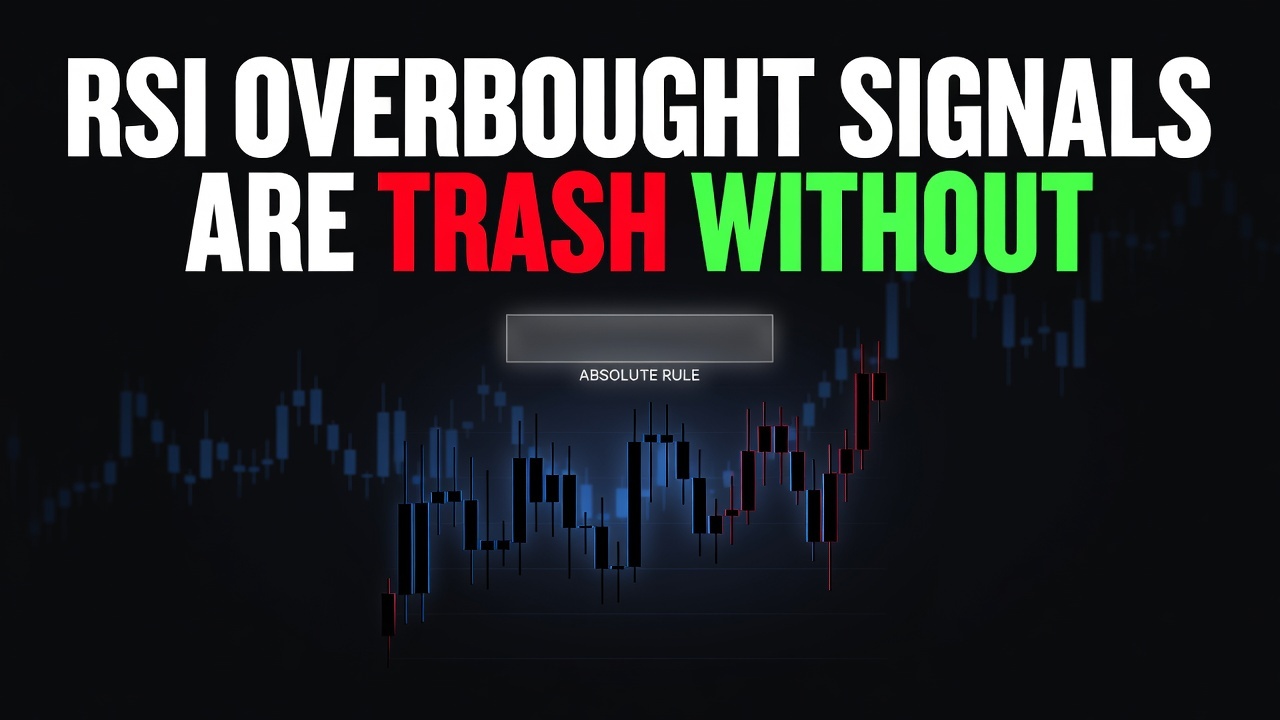
RSI Overbought Signals Are Trash Without Real Resistance

📊 September 22, 2026
- An overbought RSI in the middle of nowhere is an invitation to blow up your account.
- Retail traders treat RSI over 70 as an automatic sell signal, completely ignoring that strong momentum pins the oscillator to the ceiling while price doubles.
- Only short an overbought reading when price simultaneously rejects a high-timeframe, proven level of structural resistance.
— Ben, Find Better Trades
If you are still hitting the sell button just because the Relative Strength Index crossed above 70, you are financing the lifestyles of breakout traders. An overbought RSI is not an automatic short; it is empirical proof of aggressive buying pressure. Until that momentum smashes directly into a brick wall of actual horizontal resistance, betting against it will bleed your capital dry.
Why Everyone Gets This Wrong
Every generic trading textbook teaches the same lazy shortcut: buy below 30, sell above 70. It looks pristine on hand-picked historical charts, but in live market conditions, it systematically wipes out accounts. Retail traders treat the 70 line as an absolute ceiling instead of measuring the force driving it there.
Look at how the indicator actually functions under the hood. RSI measures the magnitude of recent gains relative to recent losses across your chosen lookback period, typically 14 bars. When an asset catches a massive influx of aggressive capital, consecutive green bars mathematically force the oscillator into overbought territory and lock it there.
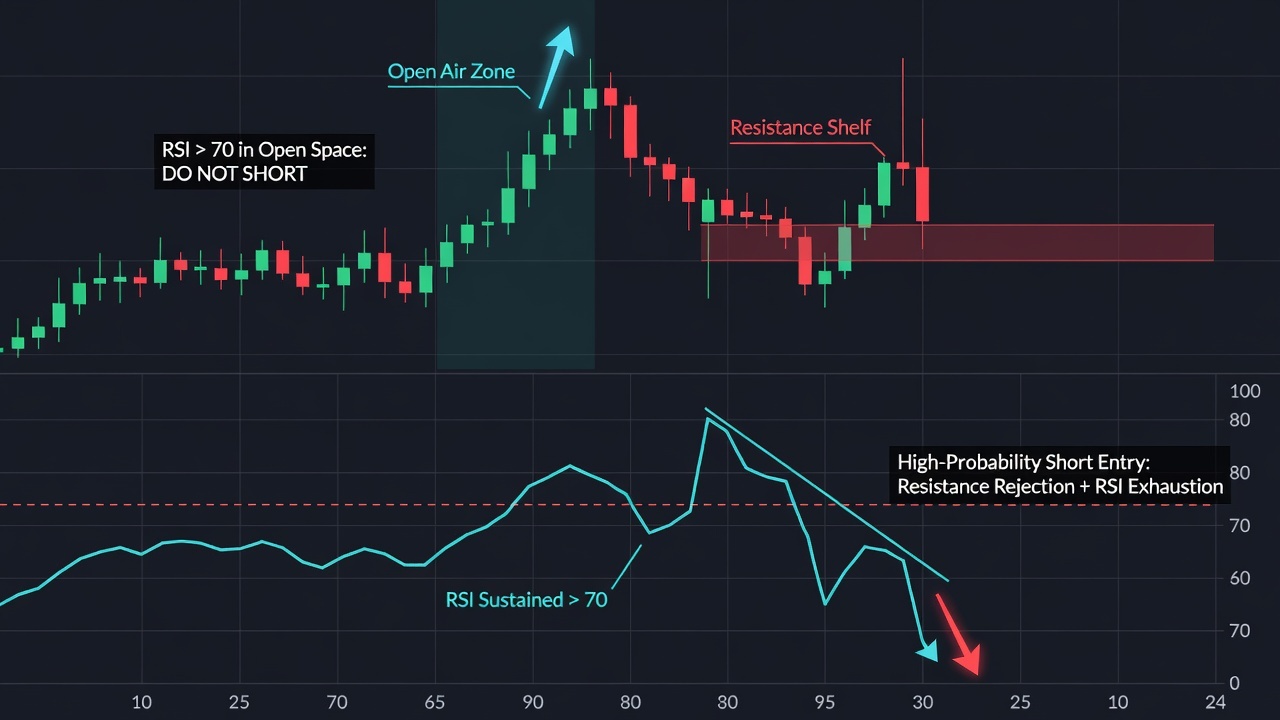
Imagine a stock breaking out of a tight four-month base on expanding volume. The RSI crosses 72 on the initial surge, climbs to 80, and stays pinned above 70 for the next three weeks while the asset runs another 35%. The trader trying to fade every tick above 70 gets stopped out repeatedly, cursing the market for being irrational.
The market is doing exactly what it was designed to do: reward sustained buying and run over counter-trend liquidity. A momentum indicator floating in open space has zero structural context, and context is the only thing that actually matters.
What Actually Works
I do not care if the RSI is at 72, 85, or 92 if price is slicing through fresh air. I only open the indicator sub-panel once price approaches a major, established price level marked on the daily or weekly chart. The price structure dictates the trade idea; the oscillator simply assists with the execution timing.
Your job is to identify high-timeframe inflection points where institutional supply is waiting. This means multi-month horizontal resistance, prior breakdown shelves, or major range highs where heavy sell orders sit on the order book. When price explodes into that pre-marked ceiling and the RSI prints an overbought reading simultaneously, you finally have an asymmetric trade setup.
Do not blindly sell the first touch of the level, either. You wait for price action to confirm that the resistance zone is actually rejecting aggressive buyers, such as a sharp upper wick or a bearish rejection candle on your entry timeframe. Once price proves the sellers have stepped in, that stretched RSI reading confirms momentum exhaustion, giving you an obvious invalidation level right above the wick.
This single adjustment flips the script on how you execute. Instead of standing in front of runaway trains in the middle of a range, you are aligning momentum exhaustion with real market structure where big players actually distribute inventory.
When RSI Can Still Help
RSI is far from useless, but its utility depends entirely on its location on the chart. Its highest-value signal occurs when an overbought reading at major resistance forms a clear bearish divergence across two consecutive swing highs.
If price pushes into a weekly supply zone to print a higher high, but your RSI fails to eclipse its previous peak and rolls over below 70, the indicator is showing you something valuable. It tells you the velocity of the buying is drying up precisely where institutional supply is heaviest.
🎯 Want Setups Like These? The Big Dipper Does the Scanning For You.
Every morning the Big Dipper delivers curated DIP ZONE trade ideas — stocks already at high-probability entry levels, with targets pre-set. No guessing, no scanning. Just setups.


Frequently Asked Questions About RSI Overbought Signals
Q: Why does RSI stay pinned above 70 for weeks during strong bull runs?
A: Sustained trends produce consecutive green candles with shallow pullbacks, which mathematically holds the 14-period RSI formula near the top of its range. In a trending market, an overbought reading simply confirms institutional accumulation rather than an impending top.
Q: What is the best timeframe to mark resistance levels for RSI trades?
A: Stick to the daily and weekly charts to identify your structural horizontal resistance zones. Intraday levels produce too many false breakouts, whereas high-timeframe supply shelves represent genuine institutional liquidity that can halt strong momentum.
Free For Traders
Learn The 3-Phase Breaker Box Strategy
Draw the range, wait for a confirmed close, and map logical profit targets with this free step-by-step trading guide.

From Find Better Trades
Know EXACTLY What To Trade At 9:30 AM
Morning Opening Range Breakout setups delivered before the bell. While everyone else is scrambling, you already have your plan.

📈 Want More? Join Our Free Trading Community
- Trading Strategy Guides Telegram — daily strategy tips and market insights
- Find Better Trades Telegram — free trade signals delivered to your phone
- Find Better Trades on YouTube — live trade breakdowns and tutorials