
RSI Divergence at Resistance: The Only Way It Actually Pays


📊 September 26, 2026
- RSI divergence floating in mid-air is financial suicide.
- Retail traders get run over because an oscillator lower high does not stop an asset with no overhead supply.
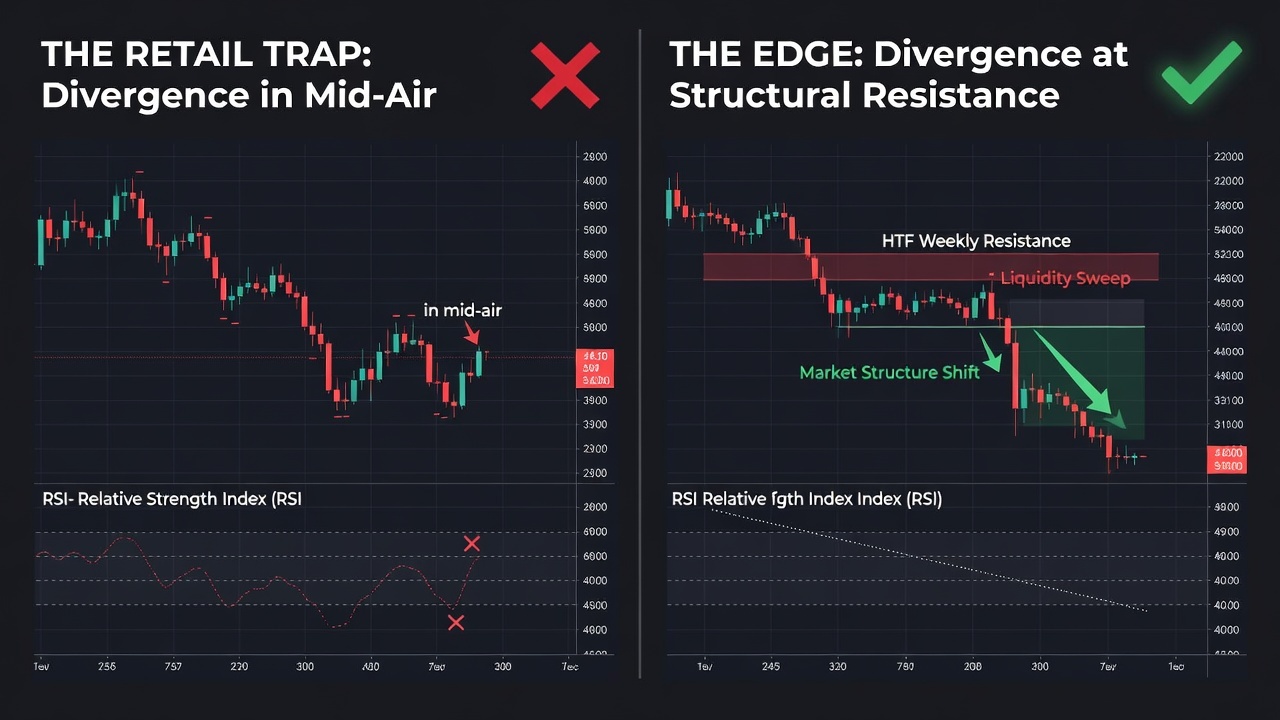
- Trade divergence only when price sweeps a multi-week resistance level and prints a confirmed structure shift.
— Ben, Find Better Trades
Most traders using RSI divergence are simply donating liquidity to momentum algorithms. They spot a lower peak on a sub-panel, smash the short button in open space, and get slaughtered on the next leg up.
A divergence is not a trade trigger; it is merely an indicator telling you velocity slowed down. Velocity slows down inside powerful bull trends constantly, right before price launches another violent impulse.
Why Everyone Gets This Wrong
Retail trading courses teach a dangerously lazy rule: price prints a higher high, RSI prints a lower high, so you sell. That textbook myth completely divorces the indicator from higher-timeframe market structure.
When an asset enters price discovery or rides an institutional bid, the RSI will peg in overbought territory for weeks. It will generate three, four, or five consecutive bearish divergences while price grinds up another thirty percent. If you short every lower high on that oscillator, you bleed out your account before the reversal ever shows up.
Picture a typical trap sequence heading into next week. An asset breaks out of a base, pushes upward through thin volume, and the oscillator shows a fading second peak. Retail shorts pile in right there, betting on mean reversion without asking a single question about supply.
Because there is zero actual supply sitting overhead, passive sellers do not step in to absorb the order flow. The trapped shorts panic, buy to cover, and blast price through the roof while RSI resets higher. Momentum deceleration does not equal aggressive selling pressure.
What Actually Works
The only setup that pays out asymmetric risk-to-reward requires RSI divergence to play second fiddle to a pre-existing resistance level. You never hunt the divergence first; you identify your heavy daily or weekly supply zones on the weekend and wait for price to test them.
When markets open Monday, watch what happens when price retests a proven, multi-touch horizontal ceiling. If price sweeps above that resistance high to grab resting liquidity while the 14-period RSI prints a visibly lower peak, your probability curve shifts dramatically.
Now you have two distinct forces aligning. You have genuine structural overhead supply where institutions previously unloaded inventory, combined with clear mathematical exhaustion on the buying side.
Even with both factors present, you do not blind-short the resistance line. You step down to the 15-minute or 1-hour chart and wait for a confirmed market structure shift—a clean close below the most recent higher low.
That structure shift proves passive supply absorbed the buyers and aggressive sellers took control of the tape. Your invalidation sits precisely one tick above the newly established liquidity sweep, leaving you with minimal risk and a massive runway back down toward prior demand.
When RSI Divergence Can Still Help
RSI divergence retains massive diagnostic value when you treat it strictly as a warning light rather than an execution trigger. It tells you when a runner is getting exhausted so you avoid making catastrophic mistakes at the worst possible time.
I use it heading into next week to protect capital on breakout setups. If a stock trades directly into heavy weekly resistance while printing sharp bearish divergence on the 4-hour chart, I immediately cancel long breakout orders and wait for a pullback.
🎯 Want Setups Like These? The Big Dipper Does the Scanning For You.
Every morning the Big Dipper delivers curated DIP ZONE trade ideas — stocks already at high-probability entry levels, with targets pre-set. No guessing, no scanning. Just setups.


RSI Divergence at Resistance FAQ
Q: What timeframes work best for trading RSI divergence at resistance?
A: The daily and 4-hour charts provide the most reliable signals because institutional order flow dominates those levels. Intraday timeframes below the 15-minute chart create far too many false divergences that get vaporized by normal daily drift.
Q: Should I change the standard 14-period setting on RSI?
A: Stick to the standard 14-period calculation because that is the baseline monitored by institutional systems and millions of retail eyes. Shortening the lookback period generates erratic noise, while lengthening it lags key inflection points at major resistance.
Free For Traders
Get Free Weekly Trade Ideas Sent Straight To Your Phone
Join thousands of traders who get high-probability setups delivered every week — no cost, no catch.

From Find Better Trades
Know Exactly Where The Big Money Steps In
Auto-plots institutional support & resistance zones from pure price action — no more guessing at levels.

📈 Want More? Join Our Free Trading Community
- Trading Strategy Guides Telegram — daily strategy tips and market insights
- Find Better Trades Telegram — free trade signals delivered to your phone
- Find Better Trades on YouTube — live trade breakdowns and tutorials


