
Moving Average Bounces Are Traps (Unless You Trade Them Like This)

📊 August 19, 2026
- Blindly buying the touch of a moving average is a losing strategy because dynamic lines have zero intrinsic support.
- The fatal flaw is treating lagging mathematical averages like brick walls instead of evaluating order flow and momentum decay.
- Wait for dynamic lines to align with horizontal structure and confirmed volume exhaustion before taking an entry.
— Ben, Find Better Trades
Most retail traders treat the 20 EMA or 50 SMA like a magical trampoline. You spot a pullback, slap a blind limit order directly on the line, and watch institutional sellers slice through your stop loss without blinking. Moving averages do not hold price; real market participants defending horizontal liquidity do.
Why Everyone Gets This Wrong
Moving averages are lagging arithmetic derivatives of past price action. They cannot create buying pressure on their own, yet retail trading books insist on treating a wavy line as unbreakable support.
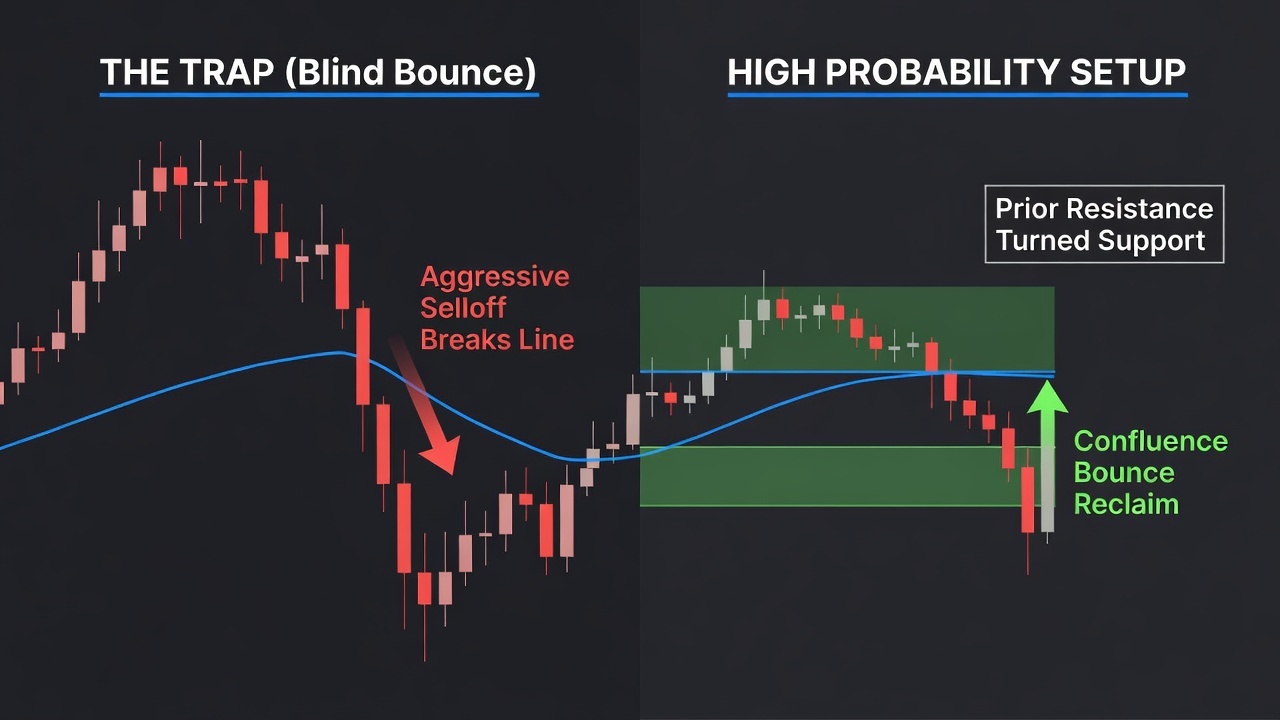
The trap unfolds predictably in every market session. A stock rallies, starts putting in smaller candle bodies with fading volume at the highs, and begins a heavy, impulsive multi-bar drop toward its 50-period line. Retail traders see the line approaching and flood the order book with limit buys, assuming the dynamic trend line guarantees a bounce.
Institutions recognize that buyer momentum vanished three candles earlier. They use that cluster of retail limit orders sitting on the moving average as exit liquidity to unload massive positions. The line collapses instantly, triggering a cascade of stop orders that accelerates the dump into support levels far below.
What Actually Works
A moving average test only turns into a high-probability trade when it collides with horizontal market structure. You must look for a prior resistance level that has flipped into support precisely where your dynamic average is sloping upward.
Next, you have to grade the velocity of the pullback into the zone. You want to see a slow, low-volume drift with overlapping candle bodies, which signals genuine profit-taking rather than aggressive institutional dumping. If price slams into the line with three consecutive wide-range red bars, you do not touch the trade.
Finally, stop placing blind orders on the line itself. Let price test the level, sweep the obvious intraday liquidity below the moving average, and print a clear rejection candle that reclaims the prior high before pulling the trigger. Your stop goes under that structural swing low, not an arbitrary pip distance from a curved indicator line.
When Moving Averages Can Still Help
Moving averages are still valuable tools when you treat them as directional filters rather than trade triggers. They act as visual speedometers, showing you whether trend momentum is accelerating, flattening out, or shifting control to the opposite side of the book.
Use them to keep yourself on the right side of broader market flow and to quickly spot overextended price moves that are overdue for mean reversion.
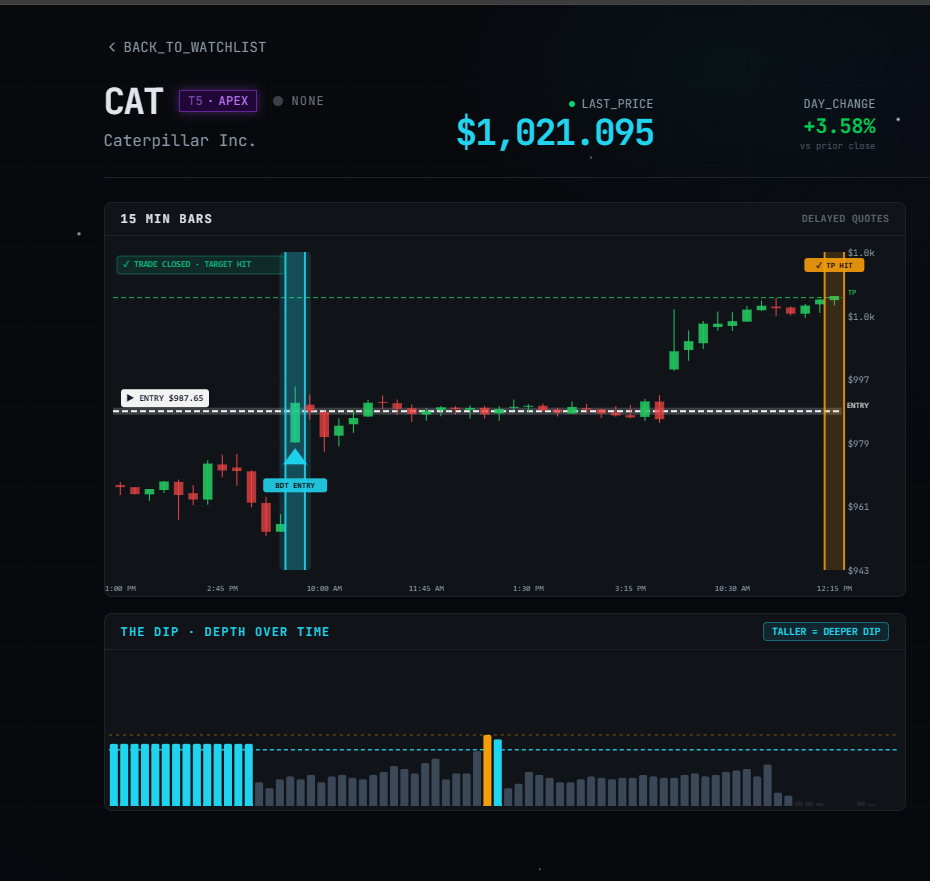
🎯 Want Setups Like These? The Big Dipper Does the Scanning For You.
Every morning the Big Dipper delivers curated DIP ZONE trade ideas — stocks already at high-probability entry levels, with targets pre-set. No guessing, no scanning. Just setups.

Moving Average Bounce FAQ
Q: Which moving average is best for trading trend bounces?
A: No single period possesses magical properties, but the 20 EMA works best for aggressive momentum pullbacks while the 50 SMA serves deeper swing pullbacks when aligned with horizontal structure.
Q: Should I place a limit order directly on the moving average line?
A: Never place blind limit orders on an indicator line. Always wait for price to touch the zone, print a clear rejection candle, and confirm that buyers are actually stepping into the order book.
Free For Traders
This Free Indicator Finds Overbought & Oversold Levels For You
Add the Red & Green Zone indicator to TradingView at zero cost. It does the level-hunting automatically on any chart.

From Find Better Trades
High-Win-Rate Patterns, Spotted In Real Time
Automated pattern recognition for reversals and continuations — no manual drawing, no missed setups.

📈 Want More? Join Our Free Trading Community
- Trading Strategy Guides Telegram — daily strategy tips and market insights
- Find Better Trades Telegram — free trade signals delivered to your phone
- Find Better Trades on YouTube — live trade breakdowns and tutorials


