
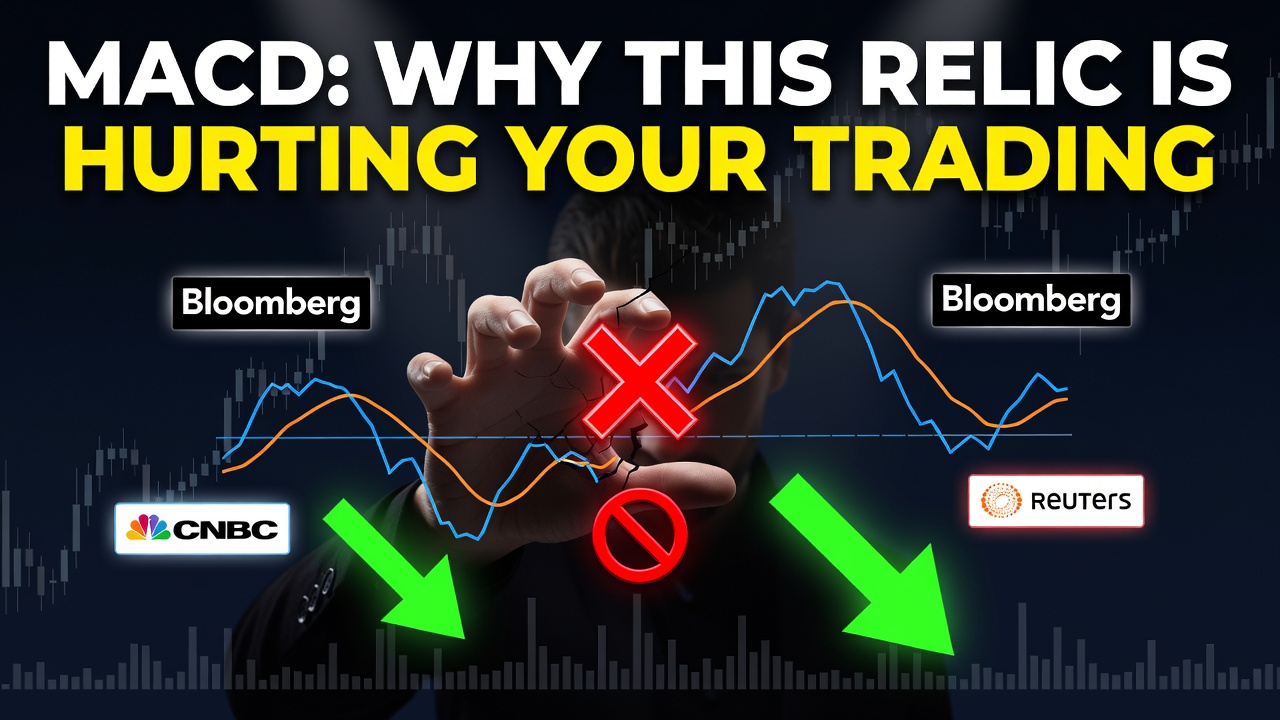
MACD: Why This Relic Is Hurting Your Trading

📊 July 9, 2026
- The MACD is an outdated, lagging indicator that consistently puts traders behind modern market moves.
- Its reliance on exponential moving averages means signals arrive too late for effective entry and exit in today’s volatile markets.
- Focus on real-time price action and robust volume analysis for superior trading insights.
— Ben, Find Better Trades
Look, I’m just going to say it: the MACD is a straight-up relic, and if you’re still relying on it for your trading decisions, you’re actively putting yourself at a disadvantage. Modern markets move too fast for such a lagging tool.
You’re not going to find any nuanced, fence-sitting takes from me on this. It’s time to ditch the MACD and start trading with tools that actually work today.
Why Everyone Gets This Wrong
The conventional wisdom about MACD is simple: buy when the MACD line crosses above the signal line (a bullish crossover), and sell when it crosses below (a bearish crossover). People also watch for divergence, thinking it signals an imminent reversal. Sounds good on paper, right?
Here’s the problem: the MACD is built entirely on Exponential Moving Averages (EMAs). EMAs are inherently backward-looking. By the time a crossover prints on your chart, the significant price move has already happened. You’re getting yesterday’s news in today’s market.
Imagine a stock that drops hard on unexpected news, then finds support and starts to consolidate. Your MACD will be plunging, signaling strong bearish momentum, well after the initial drop is done and while the stock is actually building a base. If you trade that MACD signal, you’re selling into a potential bottom. It’s like driving by looking in the rearview mirror.
Divergence is just as problematic. Price often deviates from indicators before a true reversal. Waiting for MACD divergence to confirm a turn means you’re already late to the party, missing much of the move if it even happens. It’s an almost perfect way to get whip-sawed by fakeouts.
What Actually Works
Instead of lagging indicators, focus on what’s happening right now. That means getting intimate with price action and volume analysis. These are your real-time data streams.
I teach our traders to prioritize candlestick patterns combined with significant volume. A strong bullish engulfing candle on high volume at a key support level tells you far more about immediate buying pressure than any MACD crossover ever could. It’s direct evidence of supply and demand playing out.
Think about identifying key support and resistance zones. When price interacts with these levels, especially on shifting volume, you get immediate insights into potential reversals or breakouts. Heavy volume on a breakout confirms conviction; light volume suggests a fakeout.
Building a framework around specific chart patterns – flags, pennants, head and shoulders – and validating them with real-time volume allows you to anticipate moves with far greater accuracy. You’re reacting to the market as it unfolds, not after the fact.
When This Relic Can Still Help
Alright, I’ll give it a tiny sliver of credit: the MACD, if you absolutely must use it, can sometimes provide a very broad overview of momentum on higher timeframes like daily or weekly charts. It can hint at the general direction of a longer-term trend.
However, even then, I’d still argue that simply looking at the slope of key EMAs or checking the Relative Strength Index (RSI) gives you clearer, more current trend information without the inherent lag. For anything shorter than a weekly chart, the MACD is mostly noise.
Frequently Asked Questions
Q: Why do so many traders still use MACD if it’s so bad?
A: Many traders learn MACD early on because it’s simple to understand, but they often haven’t developed the critical eye to see how its lag impacts their trading performance negatively.
Q: What should I use instead of MACD for momentum?
A: Focus on volume-weighted average price (VWAP) for intraday momentum, and for trend confirmation, look at the relative position of price to key moving averages, combined with clean price action and volume analysis.
🎯 Get High-Probability Trade Setups — Free
The Big Dipper Dashboard delivers curated trade ideas straight to your screen every morning. Know what to watch before the opening bell.

📈 Want More? Join Our Free Trading Community
- Trading Strategy Guides Telegram — daily strategy tips and market insights
- Find Better Trades Telegram — free trade signals delivered to your phone
- Find Better Trades on YouTube — live trade breakdowns and tutorials


