Candlestick Patterns Are Useless Without Volume Context

📊 July 27, 2026
- Candlestick patterns only show where price moved, but volume reveals whether smart money actually backed that move.
- Blindly trading a bullish engulfing or hammer without checking volume leads directly into retail liquidity traps.
- Require above-average volume expansion on key reversal candles before ever committing real risk capital.
— Ben, Find Better Trades
If you are still memorizing thirty different Japanese candlestick patterns like flashcards, you are setting your trading capital on fire. A classic hammer or bullish engulfing candle on a chart is nothing more than a cosmetic print until you verify who paid for it. Without volume context, raw price action is just noise designed to trap impatient retail traders.
Why Everyone Gets This Wrong
Retail trading courses love teaching candlestick patterns because they are visual, simple, and easy to package into a cheat sheet. You see a massive green engulfing candle slamming into a support level, and your brain instantly signals a high-probability buy setup. But what the course provider forgot to tell you is that a candle printed on below-average volume is an illusion.
Think about what a single candlestick actually represents on your screen. It records the open, high, low, and close price of a fixed time window, but it tells you absolutely zero about the order flow volume that created that spread. A massive fifty-pip green candle on a five-minute chart could represent heavy institutional buying, or it could simply mean liquidity dried up and two small market orders pushed price through a thin order book.
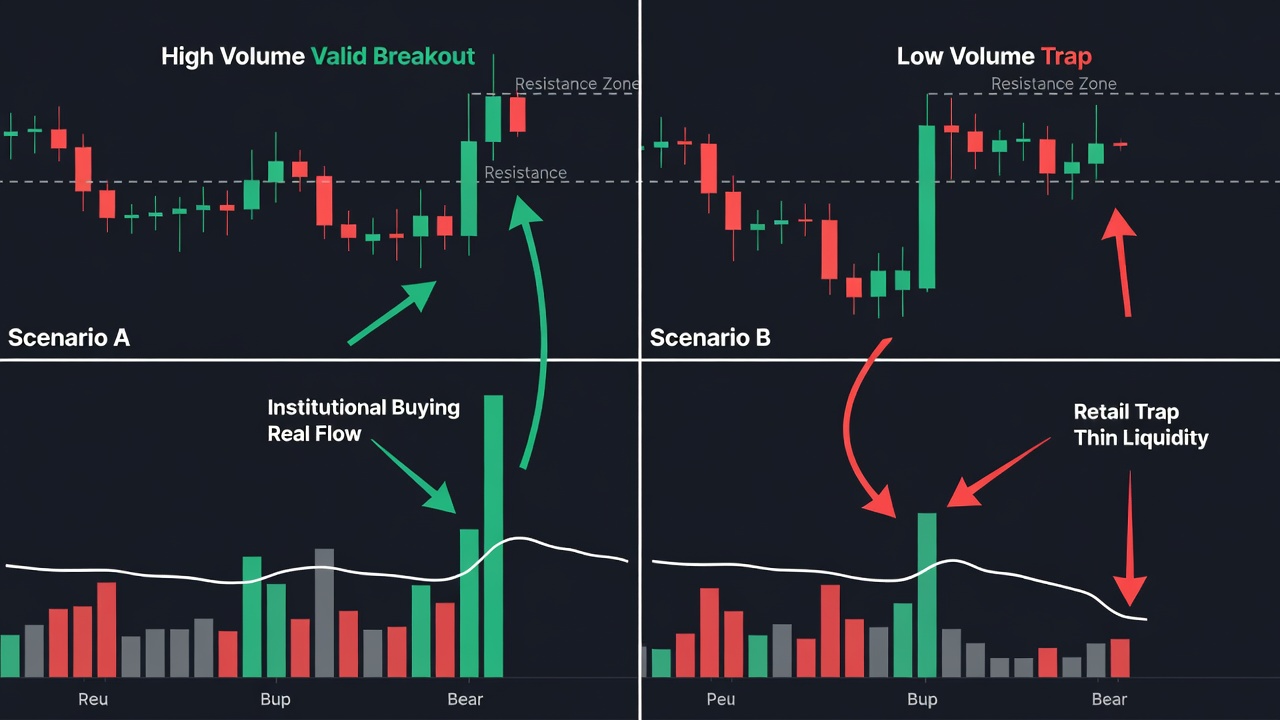
Imagine a scenario where price approaches a key horizontal support level that has held for weeks. A textbook hammer candle forms right at the level, complete with a long lower wick that supposedly shows aggressive buyers stepping in. However, when you look down at the volume bar, it is lower than the previous three consolidated candles. That long wick wasn’t aggressive buying—it was simply a lack of sellers accompanied by automated market makers sweeping local stop losses.
When you buy that low-volume hammer, you are stepping directly into a classic liquidity trap. The market makers push price up just enough to induce retail long positions, only to heavy-dump into your buy orders once real institutional supply hits the book. Without volume expansion validating the push, you aren’t trading a trend reversal; you are serving as exit liquidity for smart money.
What Actually Works
To trade candlestick patterns profitably, you must treat volume as the engine and the candle shape as merely the steering wheel. A bullish engulfing candle is completely meaningless unless it is accompanied by an unmistakable volume spike—ideally at least 1.5 to 2 times the 20-period volume moving average. When high volume aligns with a strong directional candle body, it proves that aggressive market participants spent real money to move the mark.
Start filtering every single reversal setup using a simple two-step validation process. First, identify your key structural price level on the chart, whether that is a daily order block, a major supply zone, or key VWAP deviation. Second, ignore the candle completely until the time period closes, and demand an immediate volume signature showing institutional absorption or initiative buying.
Look specifically for volume effort versus price result anomalies, which reveal the true intentions of big players. If you see a massive volume bar paired with a tiny doji candle right at a key resistance level, that isn’t indecision—that is heavy institutional supply absorbing every market buy order attempt. That high-volume doji is ten times more reliable as a reversal signal than a low-volume engulfing candle will ever be.
Once you pair clean price action with volume confirmation, your win rate and risk-to-reward ratio transform overnight. You stop taking low-conviction setups inside random consolidation zones and start trading exclusively alongside institutional order flow. You aren’t guessing if a level will hold; you are letting the volume histogram prove that smart money is actively defending it.
When Candlestick Patterns Can Still Help
Japanese candlestick shapes are not completely useless; they remain fantastic tools for timing your exact execution once a higher-timeframe volume thesis is already established. A crisp shooting star or morning star pattern gives you a clean invalidation level for your stop loss, which is critical for precise position sizing.
Just remember that the candle geometry provides the entry trigger and risk parameters, but volume provides the statistical edge. Use the visual shape of the candle to define where you are wrong, but never take the trade unless the volume histogram confirms you are right.
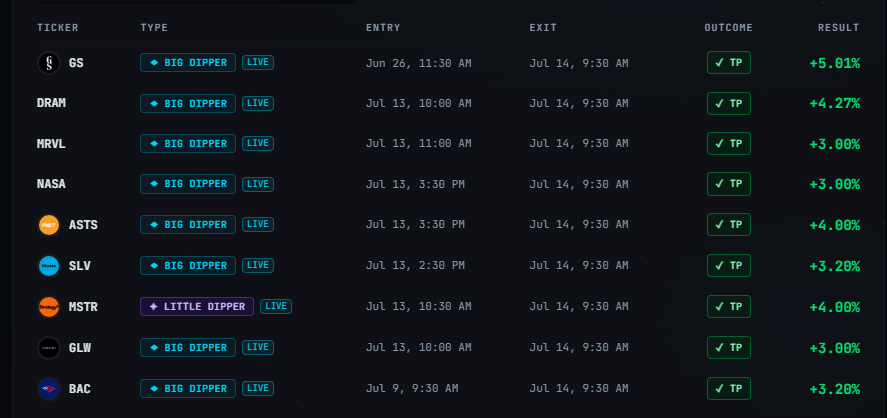
🎯 Want Setups Like These? The Big Dipper Does the Scanning For You.
Every morning the Big Dipper delivers curated DIP ZONE trade ideas — stocks already at high-probability entry levels, with targets pre-set. No guessing, no scanning. Just setups.

Candlestick Patterns FAQ
Q: What is the best volume indicator to pair with candlestick patterns?
A: A standard volume histogram with a 20-period moving average overlay is all you need. You can also use Relative Volume (RVOL) to instantly spot when a candle prints volume significantly higher than the historical average for that specific time of day.
Q: Can candlestick patterns work on higher timeframes like the daily chart without checking volume?
A: No, higher timeframe candles on low volume are just as prone to fakeouts as intraday charts. While daily candles naturally filter out market noise, a daily bullish engulfing on weak volume usually signals a low-liquidity drift rather than genuine institutional accumulation.
Free For Traders
One Clear Arrow. Every High-Probability Setup. Free.
The Fusion Indicator combines multiple signals into a single buy/sell arrow on TradingView so you never miss a move.

From Find Better Trades
Green Light Means GO. It’s That Simple.
Clear signals for directional options plays — momentum plus chain data tells you exactly which strike to buy.

📈 Want More? Join Our Free Trading Community
- Trading Strategy Guides Telegram — daily strategy tips and market insights
- Find Better Trades Telegram — free trade signals delivered to your phone
- Find Better Trades on YouTube — live trade breakdowns and tutorials