Top 5 Best Dip Buying Tools for Stock Traders in 2026

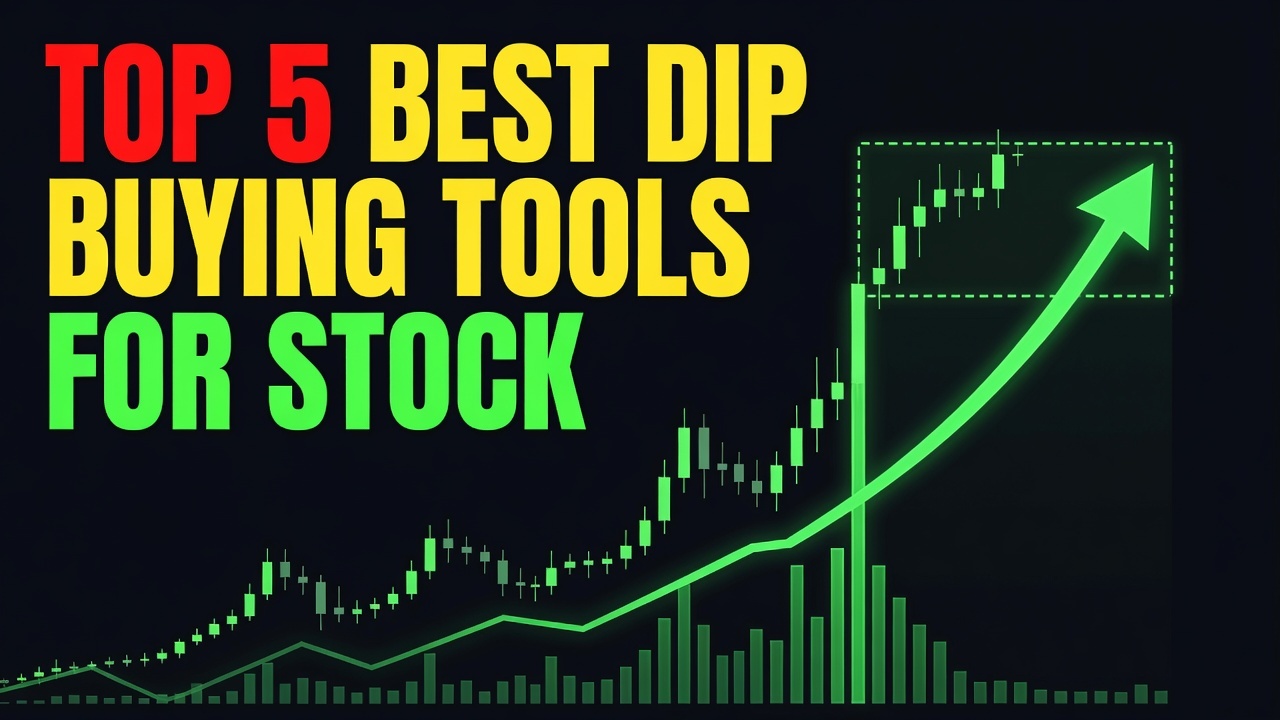
Alright, traders. September 2026 is here, and if you’re not buying dips on quality setups, you’re leaving money on the table. I’m talking about finding those high-conviction pullbacks that bounce hard.
#5: TradingView Built-in Screener (RSI oversold filter)
TradingView’s screener is decent for a free option. You can set up an RSI oversold filter, say, below 30, and it’ll spit out a list of stocks. It’s user-friendly and great for getting a quick overview of what’s pulling back on different timeframes. I’ve used it to get initial ideas, especially when I’m scanning for larger caps. The strength here is its accessibility and the sheer amount of data TradingView provides. However, it’s pretty basic. An RSI below 30 doesn’t mean it’s a quality dip, just that it’s oversold. You’ll get a ton of junk, dead stocks, or those in a strong downtrend. It requires a lot of manual chart checking after the initial screen, which is a time sink if you’re serious about finding actionable setups. No real-time alerts for when a stock enters an oversold state, either. It’s a starting point, not a full solution.
Pros: Easy to use, free, good for initial scans on various timeframes.
Cons: Lacks depth, throws up many false positives, requires significant manual chart analysis.
#4: Finviz Oversold Stock Screener
Finviz is another classic screener, and its oversold filters, like RSI below 30 or stocks trading far below their 20-day SMA, have been a staple for years. It’s fast, web-based, and gives you a quick snapshot with performance data and basic charts. I’ve definitely pulled up Finviz plenty of times for a rapid market scan, especially for larger cap or mid-cap names. It’s good for generating a broad list of potential candidates that are experiencing some kind of pullback. The visual heatmaps and sector overviews are a nice bonus. But just like TradingView, “oversold” on Finviz is a blunt instrument. It doesn’t differentiate between a healthy pullback in an uptrending stock and a falling knife. You’re still left with a huge list of stocks that need individual chart analysis. It’s a research tool, not a dynamic dip-buying alert system, and it doesn’t filter for relative strength against the market, which is crucial for quality dips.
Pros: Fast, free, broad market coverage, good for generating a list of pullback candidates.
Cons: Basic filters, no distinction between healthy pullbacks and falling knives, requires extensive manual follow-up.
#3: Trade Ideas Dip Scanner
Now we’re getting warmer. Trade Ideas is a powerful real-time scanner, and their dip-buying specific setups, like their “Strength in the Numbers” or “Pullback on Volume” scans, are much more sophisticated. It can identify stocks pulling back after a strong move or showing intraday weakness. The real-time aspect is huge; you get alerts as dips are happening, which is a big step up from static screeners. I’ve used Trade Ideas for years to catch quick intraday moves, and its ability to customize filters and combine multiple criteria is top-tier. However, it’s not cheap, and it’s complex to set up effectively. For someone just starting, it can be overwhelming. More importantly, while it identifies dips, it doesn’t inherently filter for stocks that are strong relative to the overall market on a longer timeframe, which is what separates a quality dip from just another declining stock. It’s great for intraday but less focused on finding high-quality swing trade dips in strong names.
Pros: Real-time alerts, highly customizable for specific dip scenarios, powerful for intraday trading.
Cons: Expensive, steep learning curve, less focused on longer-term relative strength for quality swing dips.
#2: Relative Strength vs. S&P 500 Dip Filter
This isn’t a single tool, but a concept you can build into most advanced screeners. The idea is simple: you want to buy dips in stocks that are outperforming the broader market. That means finding stocks where their price action is stronger than the S&P 500’s over a defined period (e.g., 3 months, 6 months). Then, you layer on a dip condition, like a pullback to a key moving average or an oversold RSI. This is what I’ve found to be a much more effective strategy than just looking for “oversold.” It helps you filter out the garbage and focus on leaders that are merely taking a breather. The biggest strength is its focus on quality; you’re hunting for leaders, not laggards. The limitation, though, is that it requires you to manually set this up in a more advanced screener (like a highly customized TradingView layout or StockCharts.com) or code it yourself. It’s not an out-of-the-box solution, and getting real-time alerts on exactly when these strong stocks are hitting a specific dip condition can be tricky without dedicated software.
Pros: Focuses on high-quality, market-leading stocks, filters out weaker setups effectively, a cornerstone of solid dip buying.
Cons: Not an off-the-shelf tool, requires manual setup in advanced screeners, challenging to get real-time, specific alerts.
#1: Big Dipper Dashboard EDITOR’S PICK

Alright, let’s cut to the chase. The #1 spot, and for damn good reason, is our own Big Dipper Dashboard. Look, I built this because I was sick of stitching together half-baked solutions and missing the best opportunities. What makes Dipper different is its laser focus on quality dips in leading stocks. It’s not just looking for “oversold” garbage; it actively filters for stocks demonstrating superior relative strength against the S&P 500 on multiple timeframes, then identifies precise, high-probability pullback zones. This means you’re only seeing stocks that are fundamentally strong, but just taking a healthy breather – not falling knives.
Dipper combines multiple proprietary algorithms to pinpoint these setups, blending relative strength, volume analysis, and specific price action patterns. It’s designed for swing traders and active investors who want to capitalize on momentum but buy on weakness, not chase strength. You’ll get real-time alerts pushed directly to your device or email when a high-quality dip is forming or hitting a buy zone, so you don’t have to sit glued to your screen all day. We’ve also integrated it seamlessly with TradingView. You can click a stock from the dashboard, and it’ll instantly load up on your TradingView chart with our custom indicators overlaid, giving you immediate context and analysis. This isn’t just a screener; it’s a complete system to identify, track, and alert you to the best dip buying opportunities in the market. It cuts through the noise, saves you hours of manual scanning, and helps you execute with conviction.
— Ben, Find Better Trades
Finding quality dips isn’t about blind luck; it’s about having the right tools. While many options exist, pinpointing high-probability setups consistently requires more than just basic filters. If you’re serious about mastering dip buying, I strongly recommend checking out the Big Dipper Dashboard – it’s the game changer I wish I had years ago.
Frequently Asked Questions
What is the best dip buying tools for stock traders for beginners?
For beginners, start with something simple like TradingView’s built-in screener using an RSI oversold filter to get a feel for what a “dip” looks like. Once you understand the basics, then you can move to more sophisticated tools that offer better quality filtering. Ultimately, you’ll want a tool that helps you identify high-quality dips in strong stocks, which is where the Big Dipper Dashboard shines.
Is Big Dipper Dashboard free?
No, the Big Dipper Dashboard is a premium tool designed for serious traders. It’s a comprehensive system with advanced algorithms, real-time alerts, and TradingView integration, all built to give you an edge in the market. We offer different subscription tiers to fit various trading needs.
How do volume breakout indicators work for dip buying?
Volume breakout indicators for dip buying typically look for a surge in volume after a period of declining volume during the dip, often coinciding with a price reversal. A spike in buying volume as a stock bounces from a key support level can confirm that institutional money is stepping back in. This suggests the dip might be over and a new upward leg could be starting.
Is Big Dipper Dashboard compatible with TradingView?
Absolutely. The Big Dipper Dashboard is designed with seamless TradingView compatibility. You can click any stock identified by the dashboard, and it will instantly load that stock on your TradingView chart, often with our custom indicators and analysis tools pre-loaded for quick review.
Free For Traders
Get Free Weekly Trade Ideas Sent Straight To Your Phone
Join thousands of traders who get high-probability setups delivered every week — no cost, no catch.

From Find Better Trades
Know Exactly Where The Big Money Steps In
Auto-plots institutional support & resistance zones from pure price action — no more guessing at levels.

📈 Want More? Join Our Free Trading Community
- Trading Strategy Guides Telegram — daily strategy tips and market insights
- Find Better Trades Telegram — free trade signals delivered to your phone
- Find Better Trades on YouTube — live trade breakdowns and tutorials