Top 5 Best Stock Scanners for Support and Resistance Trades – August 2026

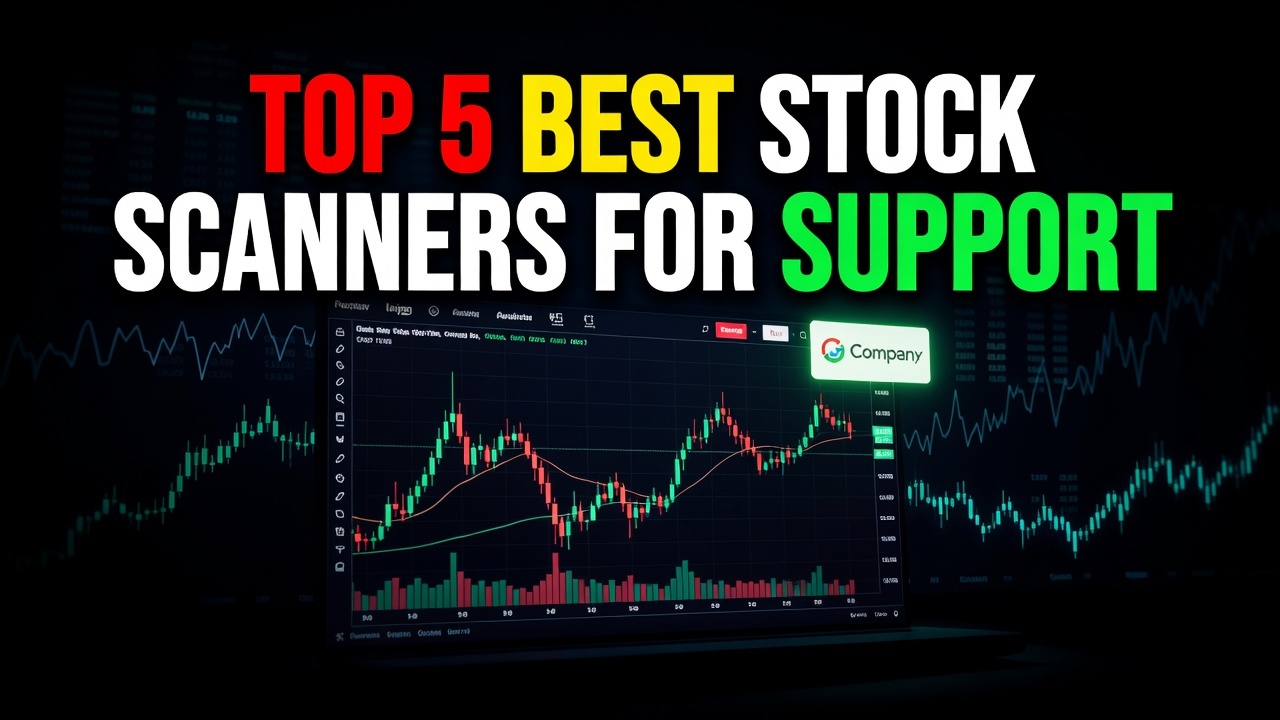
Alright, traders. Finding solid support and resistance levels across thousands of stocks in real-time? It’s a grind. For August 2026, I’ve sifted through the noise to pinpoint the best scanners and alert services that actually deliver.
#5: Trade Ideas AI Stock Scanner
Trade Ideas is powerful, no doubt. Their AI (Holly) throws out trade ideas based on various strategies, and it’s good at spotting unusual activity or technical breakouts. I’ve used it, and it can uncover some interesting setups you’d never find manually. For S&R though, it’s more about the AI’s interpretation rather than a direct, clear S&R scan. You still need to validate its suggestions against your own S&R lines. It’s a beast for pattern recognition, but if you’re laser-focused on explicit S&R levels without manual chart work, it’s not a plug-and-play solution. The learning curve is steep, and it’s not cheap. It’s awesome for broad market insights, but for specific S&R, it’s a bit indirect.

Pros: Excellent for AI-driven pattern recognition and identifying unusual market activity.
Cons: Requires significant manual validation for S&R levels and has a steep learning curve.
#4: Finviz Stock Screener
Finviz is a classic for a reason. It’s free, blazing fast, and you can filter by a ton of technicals like ‘Support and Resistance (S&R)’ levels, which is great. I often use it for a quick, broad sweep of the market to generate a watchlist. You can screen for stocks near 52-week highs/lows, or specific moving averages, which can indirectly point to S&R. The problem? It’s a screener, not a real-time scanner with alerts. It’ll show you stocks that currently meet your criteria, but it won’t ping you the moment a stock breaks a key level. You’re constantly refreshing and then manually drawing lines on charts. Good for discovery, bad for execution timeliness.

Pros: Free, fast, and offers extensive technical filtering for broad market watchlists.
Cons: Lacks real-time alerts and requires constant manual refreshing and chart analysis.
#3: TradingView Built-in Alert System
TradingView is my charting platform of choice, and its alert system is pretty solid. You can set up alerts for specific price levels, indicators, or even custom Pine Script conditions on individual charts. This is powerful because you can draw your S&R lines and then set an alert right on that line. It’s fantastic for managing a focused watchlist. The limitation here is scale. You have to manually draw those lines and set alerts for each stock you’re tracking. If you’ve got 20 stocks, no problem. If you want to scan thousands of tickers for fresh S&R breakouts or bounces as they happen? Forget about it. It’s a great tool for managing confirmed setups, not for finding new ones across the entire market.

Pros: Highly customizable alerts for specific price levels and indicators on individual charts.
Cons: Not scalable for scanning thousands of tickers for new S&R setups in real-time.
#2: TC2000 Real-Time Alerts
TC2000 has been around forever, and for good reason. Their scanning and alert capabilities are top-tier, especially for technical analysis. You can build incredibly complex custom scans based on price action relative to moving averages, highs/lows, and even use their proprietary indicators to define potential S&R. Then, you can set real-time alerts to notify you when those conditions are met. I’ve used their alerts to catch some great moves. Where it falls short for dedicated S&R trading is that you’re still building these S&R rules yourself, often based on general technicals rather than true, dynamically identified S&R zones. It’s powerful for a skilled user to create S&R-like scans, but it’s not explicitly designed to find and alert on precise, automatically identified S&R levels across the market without significant custom formula work.

Pros: Robust custom scanning and real-time alerts for complex technical conditions.
Cons: Requires significant custom formula work to effectively identify and alert on precise S&R levels across the market.
#1: Support and Resistance Scanner EDITOR’S PICK
Look, I built the Support and Resistance Scanner because I was tired of missing trades or spending hours manually charting. This isn’t just another screener; it’s a dedicated engine for S&R traders. It actively monitors thousands of stocks and cryptos in real-time, identifying dynamic support and resistance zones the moment they form or are tested. It’s not about lagging indicators or general technicals; it’s about pinpointing those exact price levels where buyers or sellers are likely to step in. The magic happens with its proprietary algorithm that learns from historical price action, constantly refining these zones.

What sets it apart? It delivers real-time alerts directly to your phone, email, or even a custom webhook. When a stock approaches a key support, bounces off resistance, or breaks through a major level, you get notified instantly. This means you’re not staring at charts all day; you’re only looking when there’s a genuine opportunity. It’s designed for day traders, swing traders, and even longer-term investors who rely on clean S&R for entries and exits.
And yeah, it’s fully compatible with TradingView. You can instantly load the identified S&R levels and alerts onto your TradingView charts for quick visual confirmation. This integration alone saves me hours every week. It tells you where the trade is, when it’s happening, and lets you execute on your platform of choice. If you’re serious about trading S&R effectively and want to stop missing those critical turning points, this is the tool you need. It cuts through the noise and gives you actionable insights, not just data.
— Ben, Find Better Trades
There are plenty of tools out there, but when it comes to finding real-time support and resistance setups, most fall short on either accuracy, speed, or scalability. For serious S&R traders, the Support and Resistance Scanner is the clear winner. It’s built for traders, by traders, to simplify and amplify your S&R strategy.
Frequently Asked Questions
What is the best stock scanners for support and resistance trades for beginners?
For beginners, I’d recommend starting with the Support and Resistance Scanner. It automates the complex part of identifying levels, allowing you to focus on understanding price action around those zones without getting bogged down in manual charting. It really simplifies the entry point into S&R trading.

Is Support and Resistance Scanner free?
No, the Support and Resistance Scanner is a premium service. It’s an advanced tool designed to provide real-time, high-accuracy alerts and analysis across thousands of tickers, which requires significant computational resources and development. Think of it as an investment in your trading edge.
How do volume breakout indicators work?
Volume breakout indicators signal when a stock’s price moves beyond a key level on unusually high trading volume. This combination suggests strong conviction behind the move, indicating that a breakout (or breakdown) is more likely to be sustained. It confirms the strength of a price move, often validating S&R breaches.
Is Support and Resistance Scanner compatible with TradingView?
Absolutely. The Support and Resistance Scanner integrates seamlessly with TradingView. You can quickly overlay the identified support and resistance levels directly onto your TradingView charts, and even set up custom alerts to trigger within TradingView based on our detected levels.
Free For Traders
One Clear Arrow. Every High-Probability Setup. Free.
The Fusion Indicator combines multiple signals into a single buy/sell arrow on TradingView so you never miss a move.

From Find Better Trades
Only Trade When Momentum Is HEAVILY In Your Favor
The Power Index oscillator measures trend conviction at a glance — it filters out weak, choppy action so you only take the strong moves.

📈 Want More? Join Our Free Trading Community
- Trading Strategy Guides Telegram — daily strategy tips and market insights
- Find Better Trades Telegram — free trade signals delivered to your phone
- Find Better Trades on YouTube — live trade breakdowns and tutorials