Why Volume Is the Only Indicator That Never Lies

📊 September 30, 2026
- Volume is raw transactional proof while every common oscillator is merely a lagging mathematical derivative of price.
- Retail traders constantly buy textbook chart breakouts without ever checking if institutional size actually fueled the move.
- Compare candle body spread directly against relative volume to spot whether institutions are accumulating shares or quietly distributing into you.
— Ben, Find Better Trades
Every popular technical oscillator sitting on your charting layout is lying to you by omission. MACD, RSI, and Stochastics are nothing more than price data run through basic arithmetic and smoothed out to look clean.
Volume is the only metric on your screen that captures real capital committing to a position in real time. If you want to know what institutions are actually doing, you look at the tape and the volume bars, not an overbought indicator.
Why Everyone Gets This Wrong
Most retail traders treat the volume sub-panel as an optional secondary filter. You spot a pristine consolidation pattern beneath resistance, notice that your favorite momentum oscillator looks healthy, and execute a market buy order the second price crosses above the line.
Two hours later, the breakout loses all upward steam and collapses back into the range, stopping you out for a full loss. You end up blaming market makers or high-frequency trading algorithms for hunting your stop.
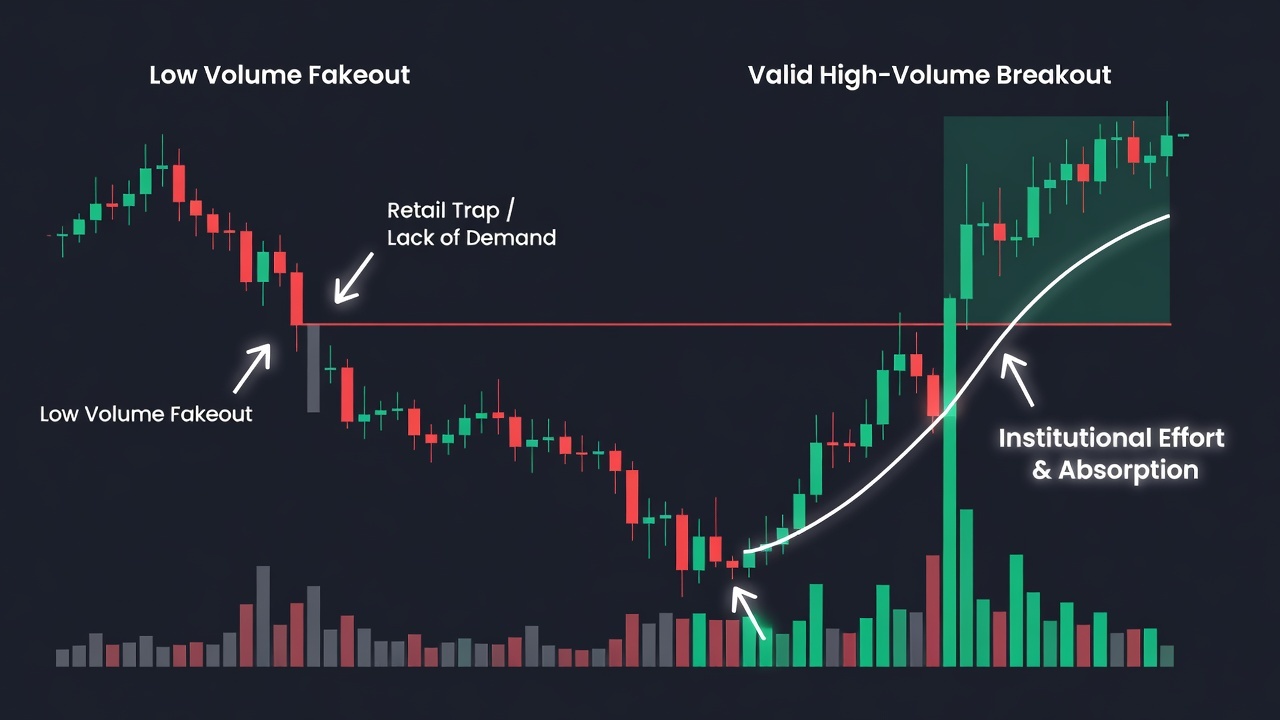
The warning sign was sitting directly beneath the price action the entire time. When price punches through a major resistance level on volume lower than the 20-day moving average, that move is completely hollow.
Price can easily drift higher on sheer lack of selling interest during thin midday trading. But a move driven by passive order fills rather than aggressive buying volume will instantly reverse the moment real supply enters the market.
Traders mistake upward price movement for buying strength. Price is merely the advertising mechanism, while volume represents the actual transactions accepted at that price.
What Actually Works
Strip your chart clean of lagging oscillators and focus on the relationship between candle spread and relative volume. Candle spread is the absolute distance between the open and the close of the bar, which represents price progress.
When you see a wide-range green candle breaking through key resistance accompanied by volume that dwarfs the preceding two weeks, you have alignment. That is institutional effort producing an intentional result, meaning large funds crossed the bid-ask spread to secure size.
The true high-probability setups reveal themselves when effort and result disagree. If price pushes into resistance with an enormous volume spike but prints a tiny candle with a long upper wick, institutions are actively absorbing buy orders and offloading inventory.
That footprint tells you smart money is distributing shares straight into enthusiastic retail buyers. You step aside or look for a short setup, because the buying pressure has been completely spent.
You also want to look for volume dry-ups on corrective pullbacks. When an uptrending stock pulls back toward a previous resistance level and the volume drops off a cliff, nobody is eager to dump shares at those prices.
That low-volume drift confirms that the selling is coming from impatient retail traders rather than fund liquidations. As soon as a single high-volume reversal bar steps in to defend that zone, you take the entry with tight, defined risk.
When Traditional Indicators Can Still Help
I am not arguing that simple moving averages or basic momentum readings have zero utility on your desk. A 20-period or 50-period moving average gives you an instant, unemotional baseline to determine whether an asset is trending or chopping in chop.
Momentum readings can also help you quickly scan thousands of tickers across an evening watchlist routine. But the moment you sit down to execute an actual order, those tools take a back seat to raw volume confirmation.
🎯 Want Setups Like These? The Big Dipper Does the Scanning For You.
Every morning the Big Dipper delivers curated DIP ZONE trade ideas — stocks already at high-probability entry levels, with targets pre-set. No guessing, no scanning. Just setups.


Volume Trading FAQ
Q: What is a good volume threshold to confirm a breakout?
A: Look for the breakout bar to print volume at least 1.5 to 2 times higher than its 20-period volume moving average. Any breakout occurring on volume below that average baseline carries a massive risk of rolling over into a bull trap.
Q: Can high volume ever signal an immediate trend reversal?
A: Yes, through what is known as climatic or exhaustion volume. When an extended trend prints an unusually massive volume bar paired with an extreme price range that fails to follow through the next day, it usually marks the final blow-off top or bottom.
Free For Traders
One Clear Arrow. Every High-Probability Setup. Free.
The Fusion Indicator combines multiple signals into a single buy/sell arrow on TradingView so you never miss a move.

From Find Better Trades
One Stock. Explosive Windows. Focused Profits.
Hyper-focused NVDA scalping service targeting the stock’s most explosive intraday windows.

📈 Want More? Join Our Free Trading Community
- Trading Strategy Guides Telegram — daily strategy tips and market insights
- Find Better Trades Telegram — free trade signals delivered to your phone
- Find Better Trades on YouTube — live trade breakdowns and tutorials