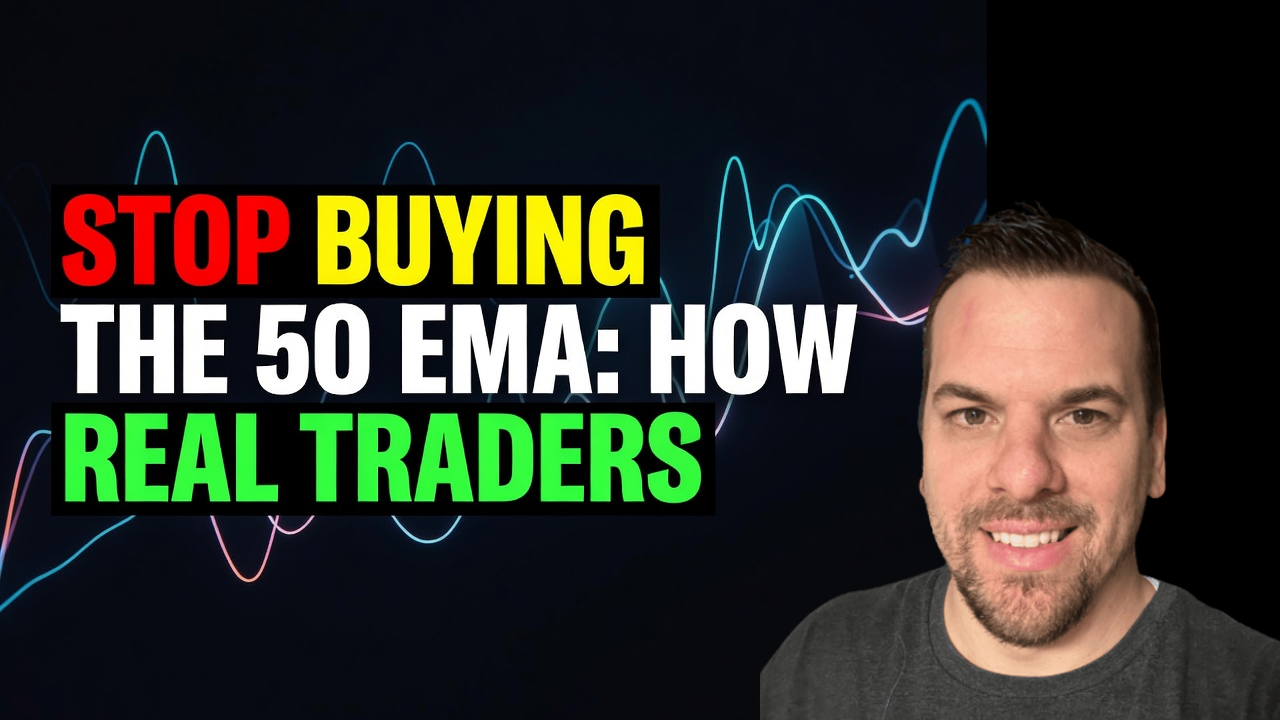
Stop Buying the 50 EMA: How Real Traders Trade Dynamic Support

📊 October 1, 2026
- The 50 EMA is an environmental filter, not a standalone floor where you fire off limit orders.
- Most retail traders buy the exact touch of the line with a tight stop right under it, offering liquidity to every institutional algorithm looking to sweep trapped longs.
- Wait for price to pierce the moving average, run the obvious liquidity, and reclaim structural horizontal support before taking the entry.
— Ben, Find Better Trades
Retail traders treat the 50 exponential moving average like a concrete trampoline. You see an uptrend, watch price pull back toward that curved line on your chart, and immediately place a limit order with your stop three ticks below it. That single sloppy habit is why you spend your trading sessions getting wicked out right before the market surges to new highs without you.
Institutional desks do not look at a mathematical smoothing of fifty closing bars and say, ‘Here is where we defend the asset.’ A moving average has zero memory of where actual capital was committed; it is just a lagging calculation following price around like a lost dog.
Why Everyone Gets This Wrong
The standard textbook doctrine tells you that the 50 EMA acts as dynamic support in a healthy trend. You are told that institutions continuously re-accumulate inventory on every test of this line. That explanation sounds neat in static hindsight charts, but live execution tells a completely different story.
Imagine a stock grinding from sixty dollars up to eighty dollars over several weeks. The 50 EMA slowly creeps up behind it, eventually sitting around seventy-two dollars. As the stock pulls back on slowing momentum, retail traders set a wall of buy orders directly at seventy-two dollars, stacking their stop losses in a cluster between seventy-one dollars and fifty cents and seventy-one dollars.
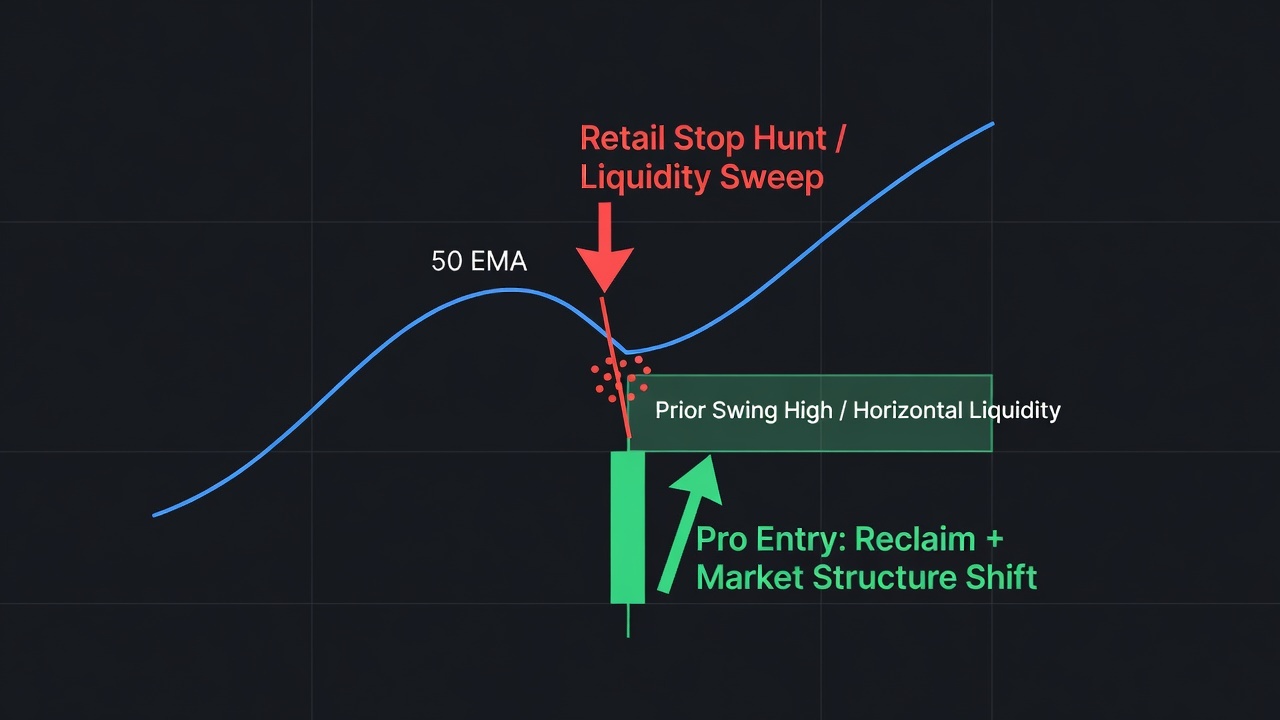
Market makers see that cluster of sell-stops plain as day. Instead of bouncing cleanly off seventy-two dollars, price slices through the moving average down to seventy-one dollars, triggers those stops to fill institutional buy orders, and then snaps right back above seventy-two. You got stopped out for a full loss, while the daily candle ends up printing a pretty hammer right back above the average.
When you rely on the 50 EMA by itself, you are trading an abstraction rather than liquidity. Moving averages stretch and warp depending on volatility; real institutional support exists where contracts actually changed hands, which is always horizontal structure.
What Actually Works
If you want to trade the 50 EMA the way profitable desks do, you must treat it as a zone of interest, not an execution trigger. The indicator tells you that the market has pulled back into a fair value region, but it gives you zero permission to pull the trigger on its own.
Your entry requires three distinct puzzle pieces to line up. First, you need horizontal price memory—a prior swing high, breakout base, or consolidation shelf—overlapping with the 50 EMA. When the dynamic line converges with a real price level where orders were exchanged, you now have structural confluence instead of just a random line.
Second, you let the market slice through the 50 EMA and sweep the retail stops sitting right below it. Do not fear the breakdown of the moving average; celebrate it. When price dips below the line and rejects lower prices by closing back above that horizontal level, that is your signal that liquidity has been harvested and the weak hands are out.
Third, wait for an aggressive shift in market structure on your execution timeframe. That means a clean displacement candle that breaks the previous lower high of the pullback, confirming that real buyers have taken control of the tape. Your stop goes under the liquidity sweep low, not tucked neatly under an arbitrary moving average line.
When the 50 EMA Can Still Help
None of this means you should strip the 50 EMA off your layout entirely. It remains one of the cleanest tools on the screen for trend diagnostics and tracking momentum exhaustion across daily and four-hour charts.
When the angle of the 50 EMA is steep and price stays comfortably above it without piercing it for weeks, you are in a runaway momentum phase where shorting is suicide. Conversely, when price repeatedly whipsaws above and below a flat 50 EMA, the indicator is bluntly telling you that directional edge has vanished and you should step aside into cash until trend structure returns.
🎯 Want Setups Like These? The Big Dipper Does the Scanning For You.
Every morning the Big Dipper delivers curated DIP ZONE trade ideas — stocks already at high-probability entry levels, with targets pre-set. No guessing, no scanning. Just setups.


50 EMA Dynamic Support FAQ
Q: Should I use the 50 EMA or the 50 SMA for dynamic support?
A: Use the 50 EMA because its weighting on recent candles reacts faster to momentum shifts in modern algorithmic trading. The 50 SMA lags too far behind to gauge immediate pullbacks cleanly.
Q: Does trading 50 EMA dynamic support work on 5-minute charts?
A: No, moving averages on intraday timeframes under fifteen minutes are mostly noise and churn. Keep the 50 EMA on the 4-hour and daily charts where institutional order flow actually clusters.
Free For Traders
Get Free Weekly Trade Ideas Sent Straight To Your Phone
Join thousands of traders who get high-probability setups delivered every week — no cost, no catch.

From Find Better Trades
Know Exactly Where The Big Money Steps In
Auto-plots institutional support & resistance zones from pure price action — no more guessing at levels.

📈 Want More? Join Our Free Trading Community
- Trading Strategy Guides Telegram — daily strategy tips and market insights
- Find Better Trades Telegram — free trade signals delivered to your phone
- Find Better Trades on YouTube — live trade breakdowns and tutorials