RSI + Support: The Only Combo You Need to Catch Real Bounces

📊 October 2, 2026
- An oversold RSI reading by itself is an absolute death trap without major horizontal price structure beneath it.
- Retail traders blind-buy sub-30 RSI prints during heavy liquidation events and get steamrolled by institutional sell volume.
- Wait for price to physically stall at a verified horizontal support shelf before you even glance at momentum exhaustion.
— Ben, Find Better Trades
Most momentum traders treat the Relative Strength Index like an automated money printer. They watch the oscillator dip below 30, slap the buy button on pure hope, and watch their account bleed out as the liquidation waterfall keeps cascading. If you are buying momentum exhaustion without confirmed structural support, you are simply donating your liquidity to institutional desks.
Why Everyone Gets This Wrong
Retail trading textbooks teach a dangerous lie: oversold means cheap, and overbought means expensive. In the real market, an RSI reading pinned below 30 simply shows that aggressive market orders are overwhelming passive limit orders. An asset can stay deeply oversold while dumping another 20% into the ground, completely wiping out your margin before any bounce materializes.
Think about how price auctions actually unfold during a real selloff. When an asset breaks through a key pivot, stop-losses trigger automatically, turning into forced market sell orders. The RSI immediately plunges into the teens, tempting amateur dip-buyers to step in front of a freight train. You get a microscopic three-pip pause, followed by another leg down that crushes every single early long.
The indicator is not broken; your application of it is. RSI is a bounded mathematical formula that measures the magnitude of recent gains against recent losses over a fixed lookback period. It has zero knowledge of order books, resting liquidity, or structural volume profiles. Expecting a mathematical derivative of closing prices to halt an aggressive institutional selloff in the middle of nowhere is pure delusion.
When you trade an RSI signal in open space, you have no logical invalidation point. If you buy at an RSI of 24 and the price drops another 5%, where does your trade thesis fail? You end up moving your stop-loss, praying for a mean reversion that comes hours too late to save your capital.
What Actually Works
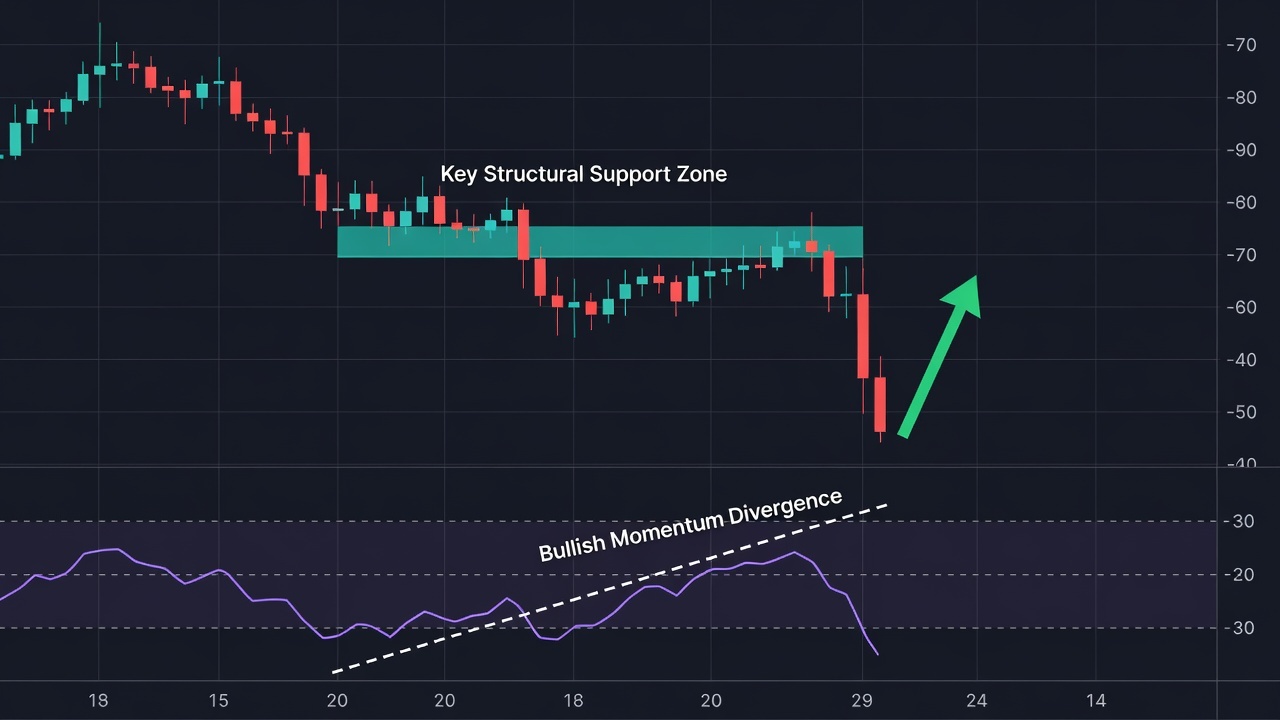
Location always dictates the trade; momentum only confirms the timing. You start by identifying an undeniable horizontal support shelf on your higher-timeframe chart where real buyers stepped in multiple times in the past. This level represents a structural zone where passive limit bids actually live, giving you a clear floor to define your financial risk.
Once price enters that defined support zone, you pull up your 14-period RSI looking for exactly one thing: momentum divergence. You want to see price form an equal low or sweep the previous support low while the RSI forms a distinctly higher trough. That single divergence proves that while price is testing deep liquidity, the underlying selling velocity is genuinely drying up.
Do not pull the trigger the second the RSI prints the divergence. Let the price tap your horizontal zone, sweep resting stop orders, and produce a clear reaction candle with a long lower wick. You only enter when the candle closes back above the support level and the RSI hooks upward from the trough.
This setup gives you an ironclad structural invalidation. Your stop-loss sits right below the wick of the liquidity sweep, not arbitrary pips away. If that horizontal shelf breaks, your thesis is instantly dead, and you take a tiny, calculated scratch rather than riding a catastrophic drawdown to zero.
When RSI Can Still Help
RSI is exceptional when used strictly as an auxiliary filter inside established macro trading ranges. When price is oscillating between clear boundary levels, an extreme oscillator reading helps you filter out low-probability chop in the middle of the range. It tells you whether an intraday push toward the range edge has real institutional gas behind it or if the move is running on fumes.
Treat it as a secondary gatekeeper, never as the trigger itself. Price structure gives you the permission to look for a trade; the RSI only gives you the final clearance to execute your order.
🎯 Want Setups Like These? The Big Dipper Does the Scanning For You.
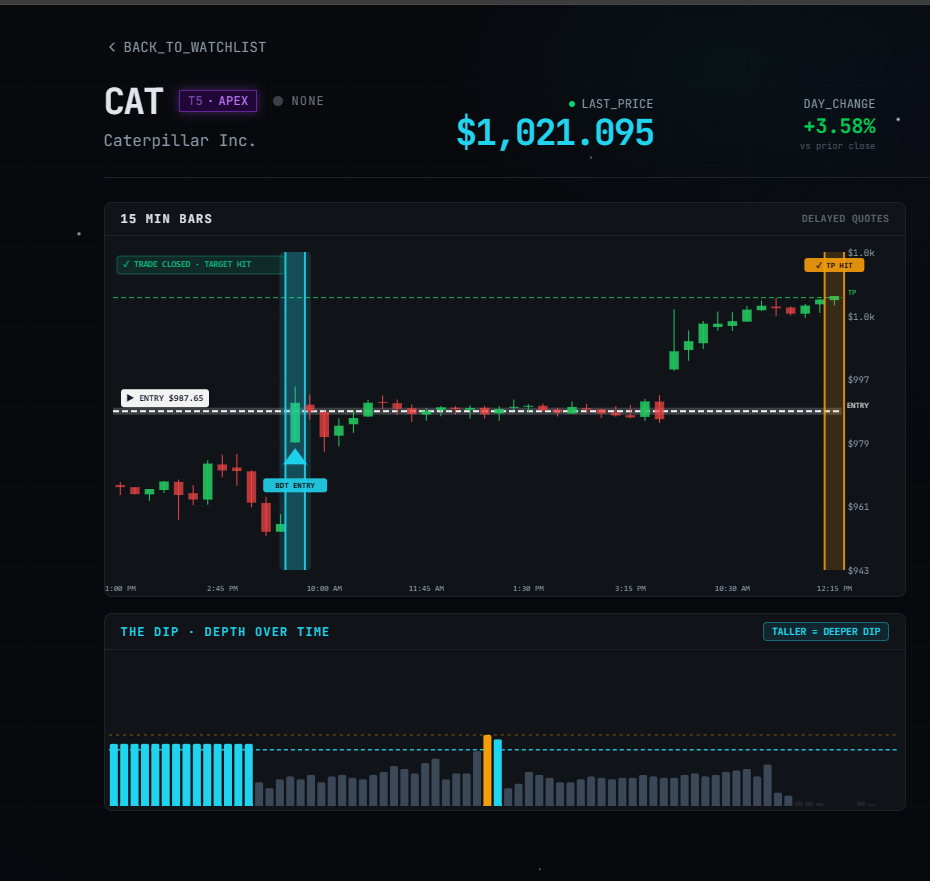
Every morning the Big Dipper delivers curated DIP ZONE trade ideas — stocks already at high-probability entry levels, with targets pre-set. No guessing, no scanning. Just setups.

RSI and Support Bounce FAQ
Q: What timeframe is best for trading an RSI bounce off support?
A: Anchor your horizontal support levels on the 4-hour or daily chart, then use the 15-minute or 1-hour RSI to spot momentum divergence and time your exact entry.
Q: Should I buy immediately when RSI crosses back above 30 at support?
A: No, wait for the actual price candle to close with clear rejection off the level to confirm that real buyers stepped in to defend the shelf.
Free For Traders
The Options Cheat Sheet Thousands Of Traders Swear By
Calls, puts, spreads — one free download tells you the right options strategy for every market condition.

From Find Better Trades
Three Candles Tell You When The Move Accelerates
The 3-candlestick reversal pattern indicator that catches the exact moment momentum flips.

📈 Want More? Join Our Free Trading Community
- Trading Strategy Guides Telegram — daily strategy tips and market insights
- Find Better Trades Telegram — free trade signals delivered to your phone
- Find Better Trades on YouTube — live trade breakdowns and tutorials