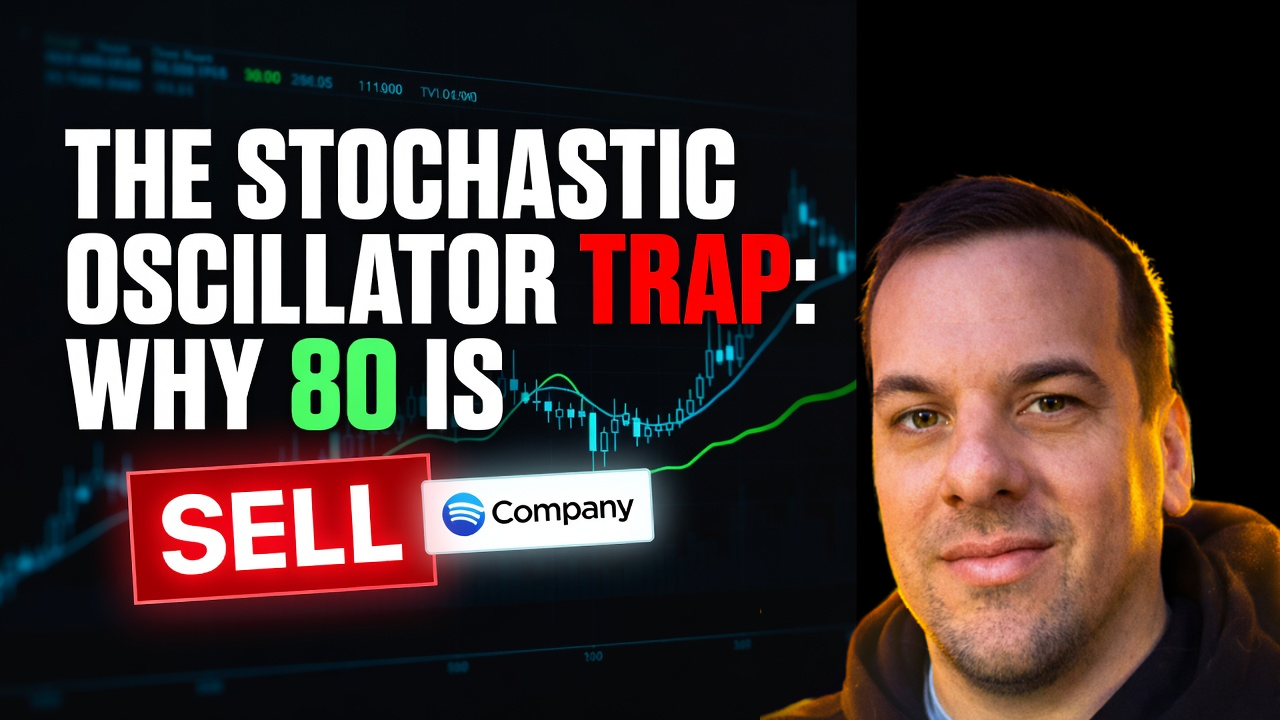
The Stochastic Oscillator Trap: Why 80 Is Never a Sell Signal

📊 September 13, 2026
- Overbought readings are proof of intense buying power, not immediate reversal triggers.
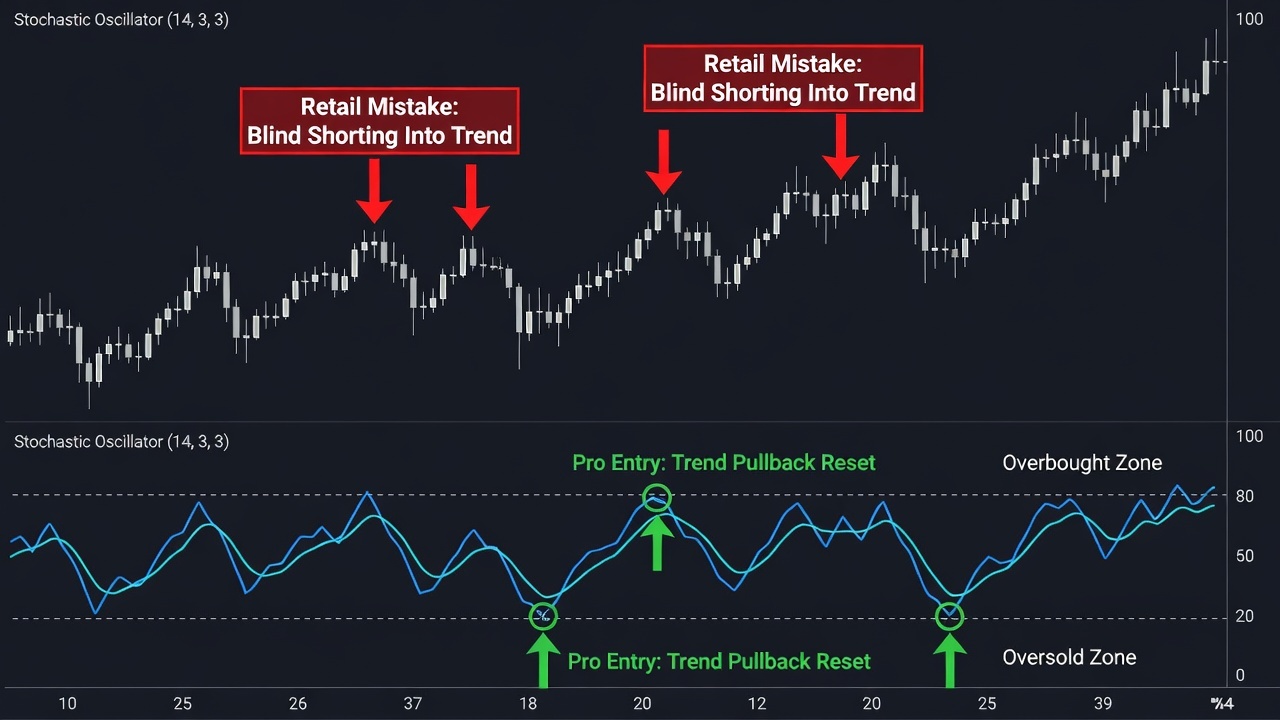
- Shorting an asset purely because Stochastic crosses below 80 steps you directly in front of runaway trends.
- Filter trades using higher-timeframe market structure and only execute when the oscillator flushes below 20 within a confirmed uptrend.
— Ben, Find Better Trades
Almost every retail trader was taught the exact same garbage when they opened their first charting account. A mentor, an ebook, or an algorithmic trading forum told you to slap on a Stochastic Oscillator, wait for the lines to cross above 80, and fire off a short order. If you have been doing that, your broker loves you, because you have been directly subsidizing everyone who actually understands order flow.
The conventional wisdom surrounding this tool is not merely flawed; it is financially suicidal in any trending market. I have watched accounts vaporize because a trader refused to accept that an asset printing an 88 Stochastic reading had no intention of slowing down.
Why Everyone Gets This Wrong
George Lane developed the Stochastic Oscillator in the late 1950s with a straightforward premise: closing prices tend to cluster near the top of the range in bull moves and near the bottom in bear moves. The core calculation simply measures where the most recent close sits relative to the total high-low range across your chosen lookback period. It does not measure intrinsic value, and it does not know where institutional supply sits.
When an instrument breaks out on heavy volume, closes cluster at the absolute top of every single candle. That naturally launches the %K and %D lines above 80 and glues them there for days or weeks. Calling that setup overbought completely confuses retail traders into thinking price is expensive and must revert.
Picture a growth stock breaking out above an eight-month consolidation zone. Price punches through resistance, printing consecutive wide-range green bars on heavy volume. A retail trader pulls up the chart, spots the Stochastic lines crossing bearishly at 86, and clicks sell short. Price pauses for thirty minutes, absorbs the supply, and rips another four percent higher while the oscillator hovers stubbornly at 82.
The trader doubles down on the short because the oscillator is even more overbought now. Two sessions later, their margin call triggers, clearing out weeks of hard-earned gains. The indicator did not fail them; their fundamental misunderstanding of momentum math did.
What Actually Works
Throw out the blind counter-trend fading before you sit down at your trading desk. The only consistent way to extract cash with this indicator is by treating it as an execution trigger for pullbacks inside an established trend. You let higher-timeframe structure dictate your bias, and you use the oscillator strictly for timing your entry at wholesale prices.
Start by identifying the primary trend on the daily or four-hour chart using swing structure or a clean moving average baseline. If the market is printing higher swing highs and higher swing lows, your short button is effectively disabled. You do not care if the Stochastic on your execution chart hits 99; you do not short strong assets in markup phases.
Instead, you wait patiently for a counter-trend retracement against that dominant move. When buyers take profits, the market pulls back toward a prior breakout level or demand zone, which flushes the Stochastic %K and %D lines down below the 20 mark. This is the oversold reset you are stalking.
When markets open tomorrow, watch how price behaves as the indicator dips into that sub-20 region. You do not buy while it is falling; you wait for %K to cross back above %D and exit the oversold zone while price tags your support shelf. That dynamic shift confirms the temporary correction has lost downside velocity, giving you a tight invalidation level right under the local swing low.
When the Stochastic Oscillator Can Still Help
I am not telling you to purge the indicator from your templates entirely; I am telling you to stop treating an oscillator as a standalone strategy. The tool carries genuine edge when you deploy it inside verified, range-bound environments where price is bouncing between rigid horizontal barriers.
If an index or commodity has tagged clear daily resistance and daily support three times without expanding, the market lacks directional trend. In that specific sideways tape, momentum shifts near 80 and 20 align cleanly with the physical boundaries of the box, offering high-probability mean-reversion entries.
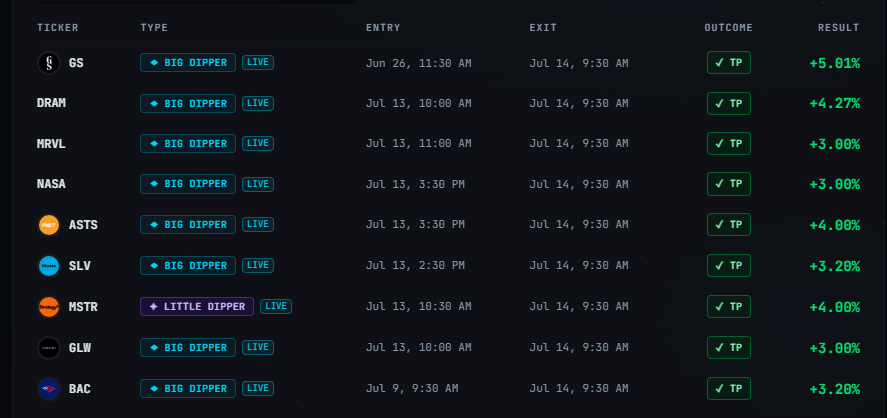
🎯 Want Setups Like These? The Big Dipper Does the Scanning For You.
Every morning the Big Dipper delivers curated DIP ZONE trade ideas — stocks already at high-probability entry levels, with targets pre-set. No guessing, no scanning. Just setups.

Stochastic Oscillator FAQ
Q: What are the best settings for the Stochastic Oscillator?
A: Leave the settings at standard 14, 3, 3 because those are the parameters institutional charting packages display. Tweaking the numbers usually just curves-fits past noise rather than fixing flawed market structure analysis.
Q: Is Stochastic better than the Relative Strength Index (RSI)?
A: Neither indicator is superior, but Stochastic reacts much faster to short-term cyclical swings while RSI smooths out price velocity over time. Use Stochastic when you need rapid timing triggers for pullbacks within a fast-moving trend.
Free For Traders
Get Free Weekly Trade Ideas Sent Straight To Your Phone
Join thousands of traders who get high-probability setups delivered every week — no cost, no catch.

From Find Better Trades
Three Signals Align. Your Phone Buzzes. That’s It.
Trisignal only fires when all three confluence conditions line up — high-probability alerts sent straight to Telegram.

📈 Want More? Join Our Free Trading Community
- Trading Strategy Guides Telegram — daily strategy tips and market insights
- Find Better Trades Telegram — free trade signals delivered to your phone
- Find Better Trades on YouTube — live trade breakdowns and tutorials