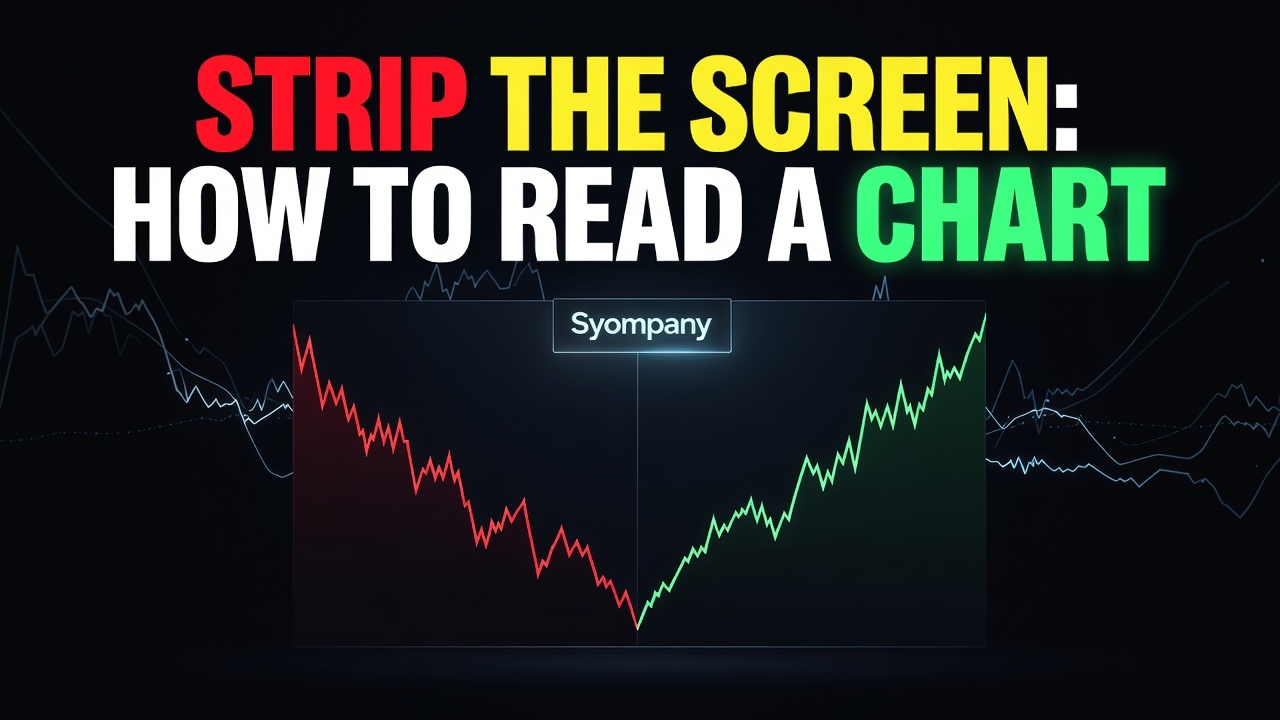
Strip the Screen: How to Read a Chart Without a Single Indicator

📊 September 11, 2026
- Indicators are derivative crutches that distort price action and delay execution.
- Overlaying lagging math formulas on your candlesticks blinds you to structural order flow and real liquidity.
- Trade market structure, candle velocity, and consolidation rejections on a clean screen instead.
— Ben, Find Better Trades
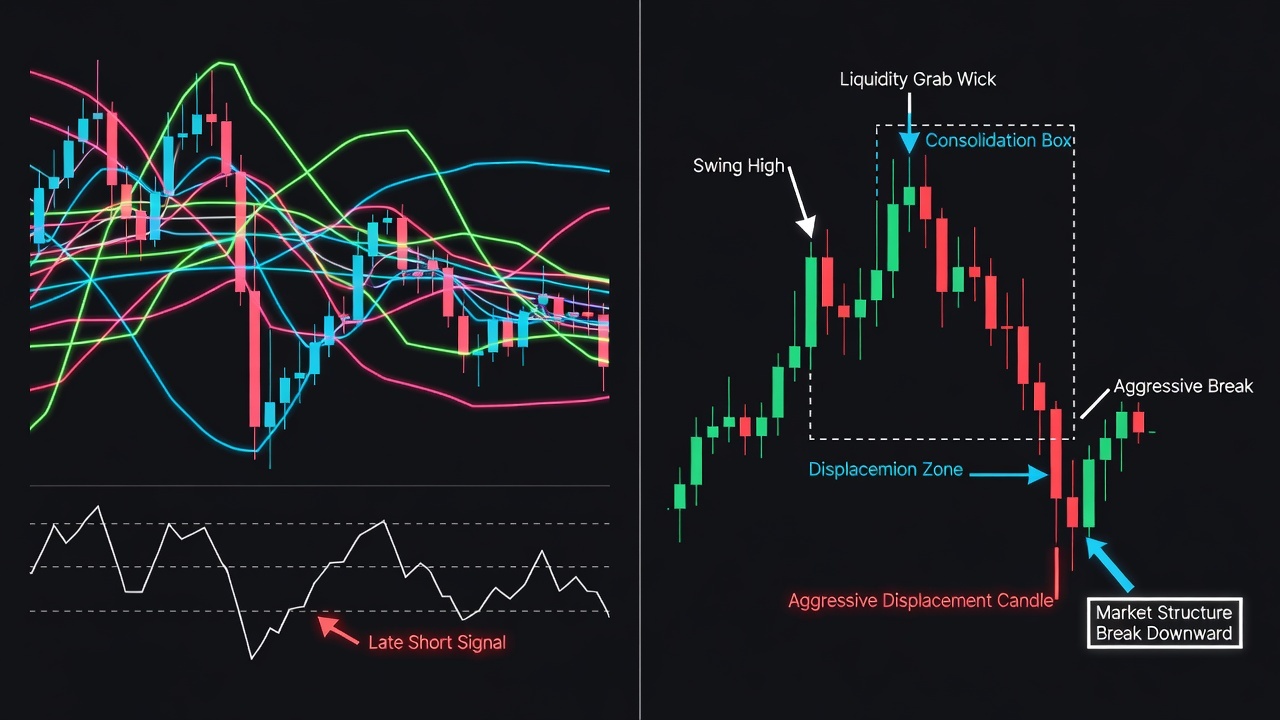
If your chart looks like a neon spaghetti factory with moving averages, Bollinger Bands, and oscillators, you are not reading the market. You are reading delayed math problems written decades ago. Piling five indicators onto a single screen does not make your trade thesis smarter; it guarantees you enter four bars late and take the hit for someone else’s exit.
Why Everyone Gets This Wrong
Retail traders love indicators because indicators provide an illusion of certainty. It feels safer to buy when a line turns green or when an oscillator crosses below twenty than to interpret an aggressive candle heading straight at support. That comfort is expensive.
Indicators are derivatives of price. They take past closing prices, average them out, smooth the curve, and project yesterday’s sentiment onto right-now reality. By definition, an indicator cannot lead; it can only follow the tape you are already looking at.
Consider a typical range breakdown. Price consolidates under resistance for three sessions, punches out a sharp wick that grabs liquidity, and immediately drops like a stone. A trader staring at raw price recognizes the failed auction and enters on the immediate rejection.
An indicator trader sits completely frozen during that initial break. Their twenty-period moving average still angles upward, and their MACD histogram has barely ticked downward. By the time the moving averages cross and flash a short signal, price is already slamming into major support, right where smart money covers and reverses the move.
What Actually Works
Reading a naked chart requires zero mathematical formulas. It demands you master three clean concepts: market structure, candle velocity, and liquidity zones.
Market structure tells you who controls the field. In an uptrend, price creates clean swing highs and higher swing lows; in a downtrend, it prints lower highs and lower lows. The second price aggressively breaks a previous swing level and closes beyond it, the auction dynamics have shifted, giving you an immediate directional bias without a single line drawn.
Candle velocity reveals institutional participation. When you see large, full-bodied bars expanding rapidly with tiny wicks, buyers or sellers are aggressively clearing out resting book orders. Conversely, tiny bodies clustered together with overlapping wicks signal indecision and absorption, warning you that the current move lacks follow-through.
Instead of guessing support with moving average bands, mark the exact bases where price consolidated before an explosive expansion. Those consolidation boxes show where heavy volume exchanged hands. When price returns to those levels, look for swift wick rejections; that is where real capital defends its inventory.
When Indicators Can Still Help
Indicators do have one specific, practical utility: automated screening across large asset universes. If I need to scan thousands of stocks before the opening bell to locate compression or unusual volume, a scanner script saves hours of manual chart flipping.
The moment a ticker lands on your active watchlist, kill the indicators and shut the sub-windows down. Execution belongs entirely to raw price, structural breaks, and clean risk points.
🎯 Want Setups Like These? The Big Dipper Does the Scanning For You.
Every morning the Big Dipper delivers curated DIP ZONE trade ideas — stocks already at high-probability entry levels, with targets pre-set. No guessing, no scanning. Just setups.


Naked Chart Trading FAQ
Q: How do you measure trend strength without using the ADX or moving averages?
A: Look at the slope of the swing points and the depth of pullbacks. Strong trends produce shallow pullbacks that barely retrace thirty percent of the impulse leg before launching another wave.
Q: Is trading raw price action more difficult for beginners?
A: It requires more focus upfront because no software signals when to click buy. However, it removes conflicting indicator signals and forces you to manage real risk around tangible price levels from day one.
Free For Traders
One Clear Arrow. Every High-Probability Setup. Free.
The Fusion Indicator combines multiple signals into a single buy/sell arrow on TradingView so you never miss a move.

From Find Better Trades
Only Trade When Momentum Is HEAVILY In Your Favor
The Power Index oscillator measures trend conviction at a glance — it filters out weak, choppy action so you only take the strong moves.

📈 Want More? Join Our Free Trading Community
- Trading Strategy Guides Telegram — daily strategy tips and market insights
- Find Better Trades Telegram — free trade signals delivered to your phone
- Find Better Trades on YouTube — live trade breakdowns and tutorials