
The Truth About Fibonacci Retracements in Stocks: Stop the Math Worship

📊 August 25, 2026
- Fibonacci retracements are completely useless on their own and will bleed your account dry if traded blindly.
- Traders treat arbitrary percentage lines like magic support levels instead of identifying where real liquidity and volume sit.
- Anchor your trades to established horizontal price structure first, using Fib levels strictly as a secondary confluence filter.
— Ben, Find Better Trades
If you think 13th-century Italian rabbit math dictates where hedge funds buy stock pullbacks, I have bad news for you. Fibonacci levels on an otherwise blank chart are nothing more than arbitrary decorative lines.
The moment you stop treating the 61.8% retracement level like holy scripture is the day your trade expectancy actually turns positive.
Why Everyone Gets This Wrong
Retail educators love teaching Fibonacci because it looks clean, sophisticated, and deceptively predictive on a static chart after the market closes. You stretch a tool from swing low to swing high, point to a bounce near the 50% line, and pretend you discovered the secret code of the market.
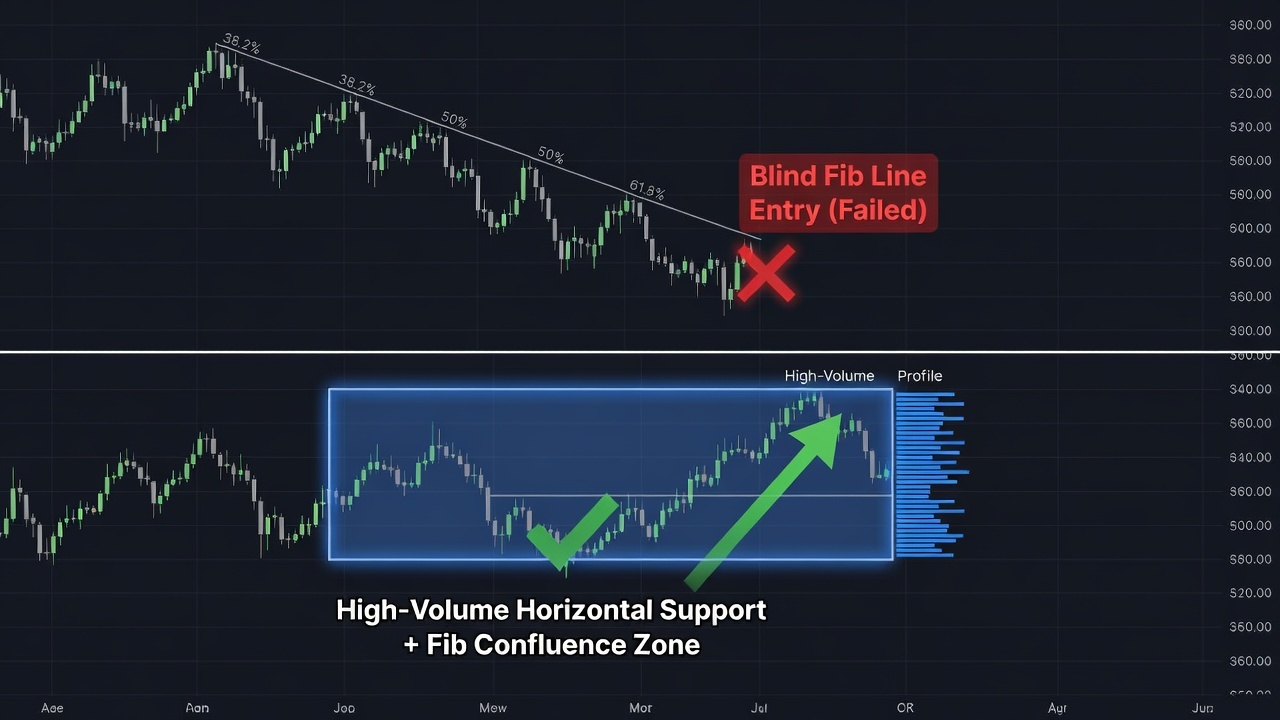
Here is what actually happens during live market execution: a high-momentum stock breaks out, pulls back, slices straight through your 38.2% level, pauses for two minutes at the 50% mark, and dumps right past 61.8% to wipe out your stop. Then, three points lower at an old breakout shelf, real institutional buyers step in and rip the stock to new highs without you.
You took a loss because order flow does not care about theoretical ratios. Institutions execute multi-million share block orders based on dark pool inventory, resting liquidity pools, and fundamental valuation—not because a line on your screen sits at 0.618.
When you place a blind limit order at a Fibonacci line without structural market context, you are simply providing liquidity to professional traders hunting retail stops.
What Actually Works
If you want to use this tool without torching capital, you must flip your entire analytical process on its head. Horizontal price structure comes first, volume profile comes second, and Fibonacci comes dead last as a minor tiebreaker.
Start by identifying an undeniable horizontal support shelf where prior resistance flipped to support with heavy volume acceptance. If that structural zone happens to coincide with a 50% or 61.8% retracement area, only then do you pay attention to the Fib level.
Even with that alignment, never front-run the level with passive limit orders. Wait for the tape to confirm that buyers are actively absorbing supply at the zone through volume spikes or clear price rejection tails before pulling the trigger.
This approach transforms Fibonacci from a dangerous predictive guessing game into a structured framework that keeps your risk strictly defined.
When Fibonacci Retracements Can Still Help
Fibonacci does serve one legitimate purpose: giving you an instant visual read on trend strength and pullback depth. When a trending stock holds firmly above the shallow 38.2% level during a consolidation, it signals aggressive buyer control and low selling pressure.
Use the tool as a quick momentum gauge to evaluate pullback quality, never as a stand-alone justification to risk your hard-earned capital.
🎯 Want Setups Like These? The Big Dipper Does the Scanning For You.
Every morning the Big Dipper delivers curated DIP ZONE trade ideas — stocks already at high-probability entry levels, with targets pre-set. No guessing, no scanning. Just setups.


Fibonacci Retracement FAQ
Q: What is the most accurate Fibonacci retracement level for trading stocks?
A: None of them are inherently accurate on their own; the 50% and 61.8% levels only produce repeatable trades when they align directly with major horizontal support and high-volume nodes.
Q: Should I place limit orders directly on Fibonacci retracement levels?
A: Never place blind limit orders on naked Fib lines. Always wait for price to reach the zone and show active buyer absorption before taking a position.
Free For Traders
One Clear Arrow. Every High-Probability Setup. Free.
The Fusion Indicator combines multiple signals into a single buy/sell arrow on TradingView so you never miss a move.

From Find Better Trades
High-Win-Rate Patterns, Spotted In Real Time
Automated pattern recognition for reversals and continuations — no manual drawing, no missed setups.

📈 Want More? Join Our Free Trading Community
- Trading Strategy Guides Telegram — daily strategy tips and market insights
- Find Better Trades Telegram — free trade signals delivered to your phone
- Find Better Trades on YouTube — live trade breakdowns and tutorials


