
RSI Divergence Is a Retail Trap — Here’s What Actually Works


📊 August 20, 2026
- RSI divergence is one of the most consistent account-killers in technical analysis because it tricks traders into fading strong trends.
- The indicator simply measures velocity, meaning RSI naturally drops as a strong trend transitions from explosive momentum into a steady grind.
- Trade market structure shifts and liquidity sweeps at key levels instead of front-running momentum indicators.
— Ben, Find Better Trades
If you want a guaranteed way to bleed capital, try shorting a runaway bull market just because the 14-period RSI printed a lower high. Retail trading courses love marketing RSI divergence as a secret cheat code for picking exact market tops and bottoms. In reality, it is a lagging mathematical artifact that routinely gets pulverized by institutional volume.
Why Everyone Gets This Wrong
The standard textbook theory sounds convincing on the surface: price prints a higher high, the oscillator prints a lower high, therefore buying momentum has died and a reversal is imminent. That neat theory disintegrates the second an asset enters a sustained trend.
When price trends aggressively, the RSI spikes into deeply overbought territory on the initial breakout thrust. As the move continues, price often grinds steadily upward with smaller, overlapping candles, which mathematically forces the oscillator lower even though buyers remain completely in control.
Imagine an asset launching from 100 to 125 in three giant green bars, pushing the RSI to 82. Over the next two weeks, it grinds upward from 125 to 140 with small, steady daily gains, pulling the RSI down to 64. If you short that “bearish divergence,” you are stepping in front of a freight train while price mercilessly runs over your stop loss.
Divergence simply tells you that the velocity of the move has slowed down, not that sellers have taken over. Shorting a market purely because it is rising at a slightly slower rate is financial suicide.
What Actually Works
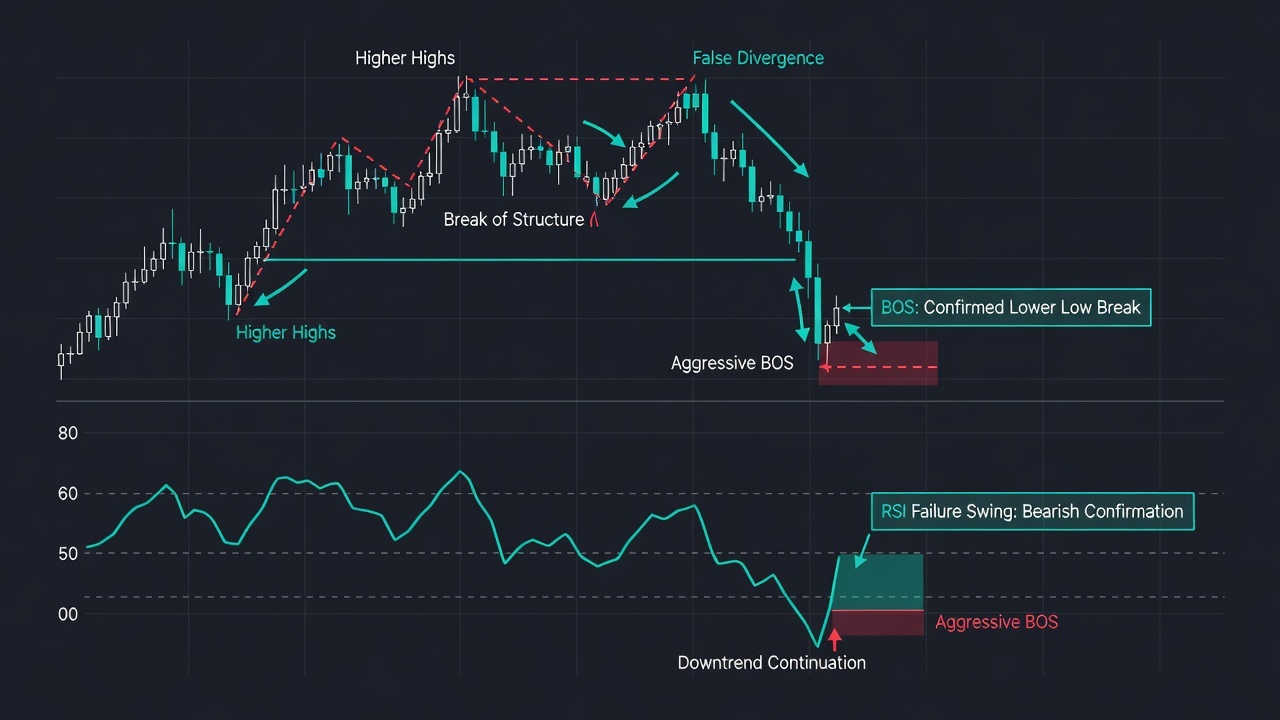
If you want to trade market reversals profitably, stop looking at sub-chart oscillators to predict turns and start demanding market structure confirmation on the price chart itself. Forget the indicator until the asset actually breaks a key higher low on a meaningful timeframe.
A genuine high-probability reversal requires a clear change of character or break of structure, where price aggressively displaces below the previous swing low. Once that structural break prints, you wait for a low-volume retest of the broken level to take your entry, with a crystal-clear invalidation point right above the swing high.
Combine that structural break with a liquidity sweep above an established resistance level. When institutional order flow sweeps resting buy stops above an old high and immediately rejects back inside the range with heavy volume, you have real market confirmation rather than oscillator hope.
If you still want an indicator to confirm your bias, require a price structure shift first, followed by a failure swing on the oscillator. Price must always lead; indicators should only ever confirm what price has already done.
When RSI Can Still Help
RSI divergence does offer practical value in one specific environment: a confirmed, sideways trading range. When price sweeps the upper or lower boundary of a multi-week consolidation without volume expansion, a divergence can provide a reliable cue to fade the move back toward the range midpoint.
Outside of range-bound chop, treat divergence as nothing more than a yellow warning light to trail stops on existing trend positions, never as an active signal to initiate counter-trend trades.
🎯 Want Setups Like These? The Big Dipper Does the Scanning For You.
Every morning the Big Dipper delivers curated DIP ZONE trade ideas — stocks already at high-probability entry levels, with targets pre-set. No guessing, no scanning. Just setups.


RSI Divergence FAQ
Q: Why does RSI divergence generate so many false signals in strong trends?
A: The RSI formula measures the magnitude of recent gains versus losses, so when an asset transitions from an explosive move into a steady trend, the indicator drops even though price continues making new highs.
Q: What is the most reliable confirmation to pair with an RSI divergence?
A: Wait for a confirmed break of market structure on the price chart, specifically an impulsive close below the most recent higher low, rather than entering blindly on the divergence alone.
Free For Traders
Know What To Trade BEFORE The Opening Bell
The Big Dipper Dashboard hands you curated high-probability setups every single morning — free.

From Find Better Trades
Stop Drawing Trendlines By Hand. Seriously.
Terraline auto-draws algorithmic trendlines that adjust in real time — perfectly connecting the swings you’d spend hours finding manually.

📈 Want More? Join Our Free Trading Community
- Trading Strategy Guides Telegram — daily strategy tips and market insights
- Find Better Trades Telegram — free trade signals delivered to your phone
- Find Better Trades on YouTube — live trade breakdowns and tutorials


