Here’s Exactly What the Big Dipper Dashboard Is and How It Works


📊 October 6, 2026
- The Big Dipper Dashboard is a live scanning terminal that detects high-probability pullback setups across the market in real time.
- It stops traders from chasing overextended breakouts and flags verified dips into structural support instead.
- Built specifically for active swing traders and dip buyers who want clear setups without scanning hundreds of charts manually.
— Ben, Find Better Trades
Every single week, I see the same costly mistake happen in trading rooms. Traders see a stock ripping higher, chase green candles at the top, and end up holding the bag when smart money takes profit.
The tool I use for this: Support and Resistance Scanner. Real-time Telegram alerts when stocks approach critical S&R levels across the whole market. Get The Scanner →
I built the Big Dipper Dashboard because buying quality assets on strategic pullbacks is where the best risk-to-reward setups actually live. Instead of staring at hundreds of watchlists all day, I wanted a single screen that reveals exactly where market pullbacks are turning into genuine buying opportunities.
What Is Big Dipper Dashboard?
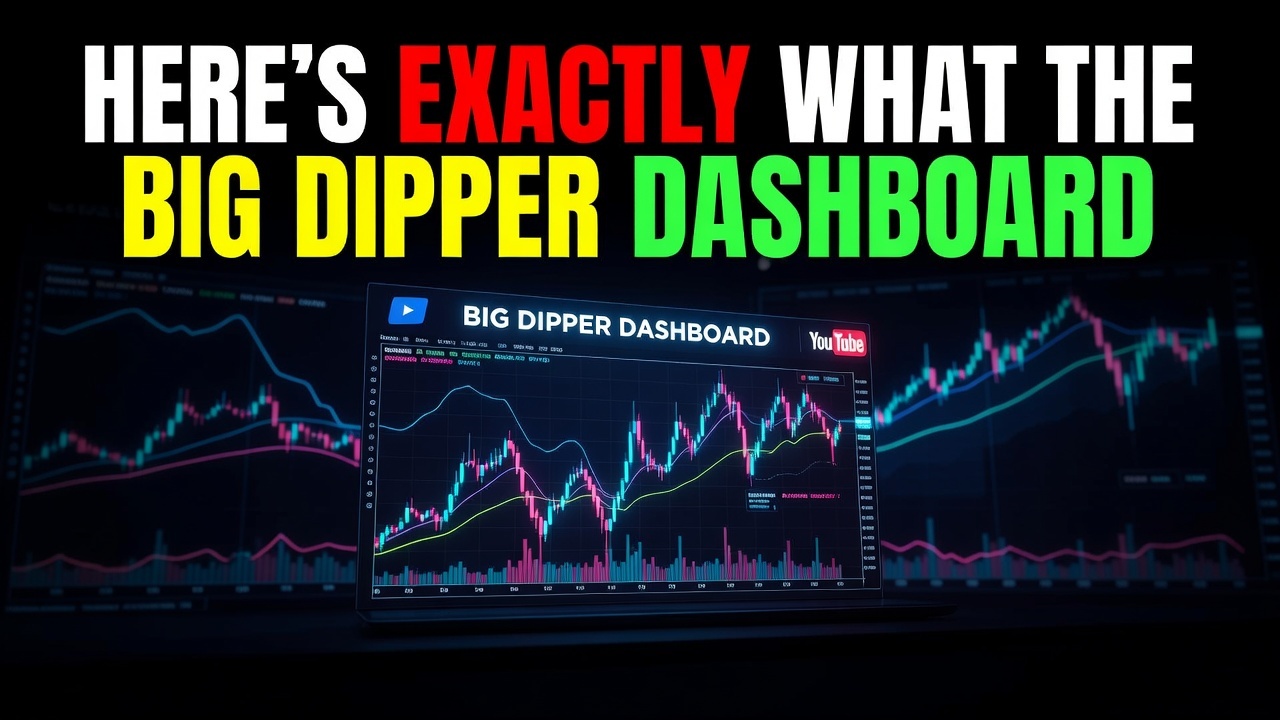
The Big Dipper Dashboard is a standalone, web-based market scanner engineered to spot institutional dip-buying setups across thousands of tickers. It is not an overwhelming spreadsheet or a cluttered indicator that paints fifty lines all over your chart.
You access the dashboard straight through your web browser, which means there is zero software to install and no complex scripting to manage. It acts as an operational command center that does the heavy lifting of market breadth and price action analysis for you.
If you want a breakdown from another angle, our sister site TradingStrategyGuides.com published an exhaustive walkthrough of the platform. You can check out that full TSG review using the link at the end of this article.
Inside the dashboard, you get clean, organized feeds of assets hitting specific oversold criteria within established uptrends. It gives you the ticker, the setup classification, and the exact technical context you need before you place an order with your broker.
How Big Dipper Dashboard Works
The core logic behind the dashboard comes down to trend alignment and momentum exhaustion. A dip is only worth buying if the higher-timeframe trend is still intact and the immediate selling pressure is drying up.
The system monitors price action across the broader market, automatically filtering out broken charts and penny stocks with trash volume. When a strong stock pulls back into a high-confluence zone—like an anchored volume profile node or a key moving average shelf—the dashboard flags it.
Say an enterprise tech stock has been trending upward for months but takes a sharp, three-day hit on broad market weakness. Rather than guessing where the knife stops falling, you open the Big Dipper Dashboard and see the ticker pop up with an oversold exhaustion tag right at proven support.
From there, you check your chart, define your invalidation level below that support zone, and plan your trade with precision. You eliminate the emotional guesswork because the tool alerts you only when the pullback meets strict mathematical parameters.
Free For Traders
One Clear Arrow. Every High-Probability Setup. Free.
The Fusion Indicator combines multiple signals into a single buy/sell arrow on TradingView so you never miss a move.

Who Should Use It
This dashboard is built primarily for active swing traders and momentum traders who prefer buying pullbacks rather than chasing runaway breakouts. If you have a day job or limited screen time, having an automated scanner find the setups saves hours of evening prep work.
It is also a great fit for traders who struggle with execution discipline. When you know you are buying at quantified support rather than reacting to social media chatter, pulling the trigger becomes infinitely easier.
That said, this tool is not for long-term passive index investors who just buy index funds and look away for thirty years. You also need a foundational understanding of basic chart reading, position sizing, and stop-loss placement to trade these setups safely.
From Find Better Trades
Know Exactly Where The Big Money Steps In
Auto-plots institutional support & resistance zones from pure price action — no more guessing at levels.

Frequently Asked Questions About Big Dipper Dashboard
Q: Does the Big Dipper Dashboard execute trades directly inside my brokerage account?
A: No, the dashboard is a specialized scanning and analysis tool that surfaces setups, meaning you maintain total control over your own trade entries and broker execution.
Q: Do I need expensive charting software to make this work?
A: Not at all, because the dashboard runs completely in your web browser and pairs seamlessly with any free charting platform you already use.
For a detailed second look and extra platform testing notes, be sure to read the full TSG review on our sister site TradingStrategyGuides.com.
📖 Read our full Big Dipper Dashboard review on TSG — TradingStrategyGuides.com
📈 Want More? Join Our Free Trading Community
- Trading Strategy Guides Telegram — daily strategy tips and market insights
- Find Better Trades Telegram — free trade signals delivered to your phone
- Find Better Trades on YouTube — live trade breakdowns and tutorials