
RSI Divergence at Resistance: Stop Shorting Without Structure

📊 August 12, 2026
- RSI divergence at resistance is an expensive trap if you use it as an automatic entry signal.
- The single biggest mistake is shorting immediately when RSI drops while price grinds into key levels.
- Wait for price to sweep resistance, print the divergence, and trigger a lower-timeframe structure break before risking capital.
— Ben, Find Better Trades
Most retail traders treat RSI divergence at resistance like a guaranteed money printer. They see price hit a ceiling, notice RSI making a lower high, and slam the short button without a second thought.
I have watched that exact mechanical mistake wipe out thousands of trading accounts. In strong market moves, indicators will stay divergent while price steamrolls right through your stops.
Why Everyone Gets This Wrong
Retail finance blogs love telling you that indicator disagreement equals an immediate trend reversal. That is pure nonsense, and it misses how institutional order flow actually works.
In a powerful uptrend, momentum indicators get overbought and naturally slope downward while price continues climbing. This happens because RSI measures the speed of price changes, not price destination.
Imagine a stock rallying straight into a major supply zone. Price prints a fresh high at $105 while RSI tops out significantly lower than its previous peak, creating a textbook bearish divergence.
Amateur traders jump short right at $105, slapping their stop loss just above the level. Institutional buyers step in, absorb the weak sellers, and push price up to $107 to sweep all those obvious stop losses before dropping.
If you shorted the divergence alone, you got wiped out right before the downward move you predicted actually happened.
What Actually Works
Stop using RSI divergence as an execution button and start treating it as a heads-up display. When I spot bearish divergence at a key level, I lock my hands under my seat and wait.
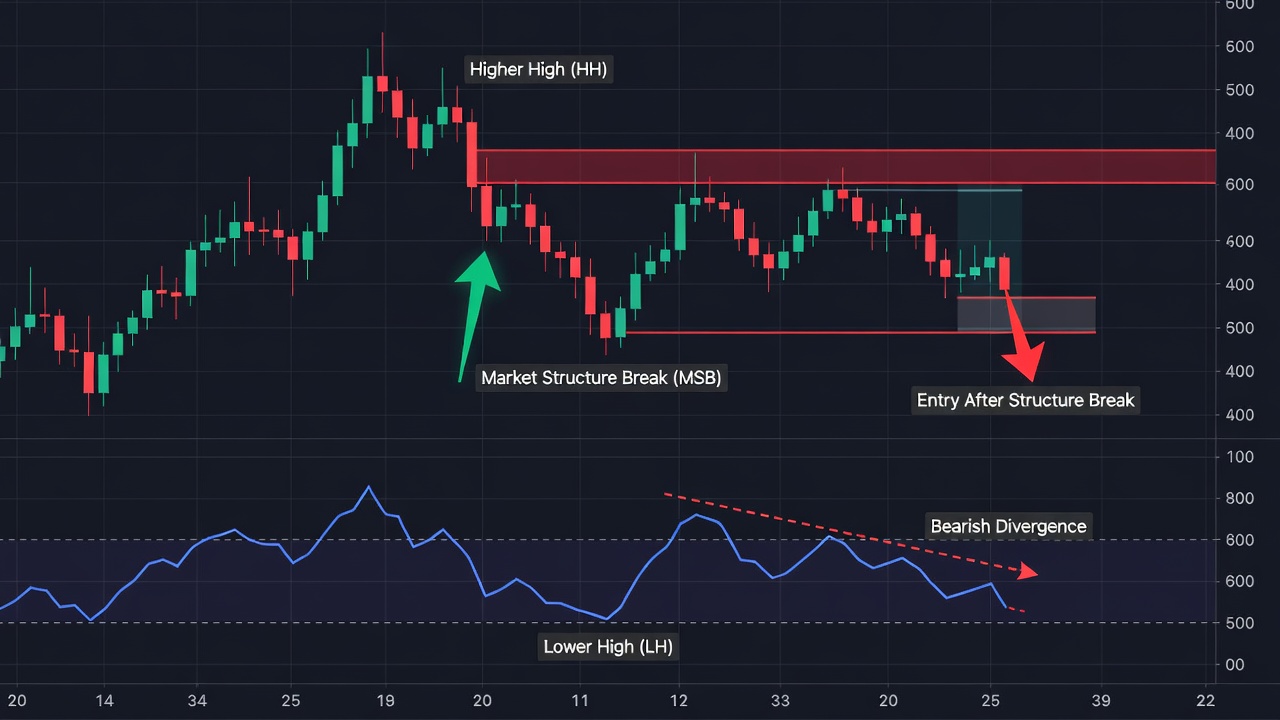
The setup that actually pays requires a three-step confirmation sequence. First, let price tap into the resistance level and ideally sweep the previous high to drain rest-of-market liquidity.
Second, confirm that the bearish divergence exists across your anchor timeframe. This tells you momentum is decaying while institutions are unloading positions.
Third—and this is completely non-negotiable—you must wait for a lower-timeframe market structure break. Price must crash through the specific swing low that created the resistance tap.
Once structure breaks down, you short the corrective retest. Place your stop loss safely above the newly formed local swing high, giving your trade real breathing room.
When RSI Divergence Can Still Help
I am not telling you to throw the Relative Strength Index out the window entirely. It remains a fantastic tool for gauging underlying momentum exhaustion when paired with proper context.
When price hits key resistance and RSI fails to make a higher peak, it gives you permission to stop buying breakouts into supply. Use it to kill your bullish bias, but force price structure to validate your short.
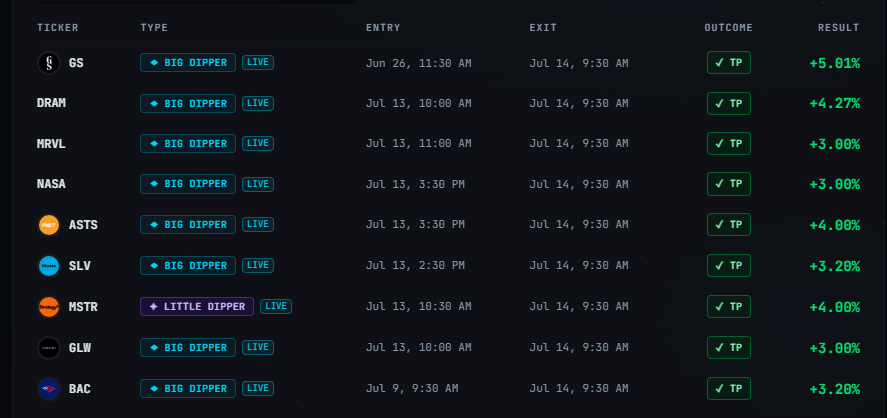
🎯 Want Setups Like These? The Big Dipper Does the Scanning For You.
Every morning the Big Dipper delivers curated DIP ZONE trade ideas — stocks already at high-probability entry levels, with targets pre-set. No guessing, no scanning. Just setups.

Frequently Asked Questions About RSI Divergence
Q: What is the best timeframe to trade RSI divergence at resistance?
A: Identify the divergence on higher timeframes like the 4-hour or daily charts for reliable context, then drop to the 15-minute chart to trade the market structure break.
Q: Should I change the standard 14-period setting for RSI?
A: Keep the standard 14-period setting. Customizing indicator settings usually leads to curve-fitted noise rather than actual edge in live market execution.
Free For Traders
One Clear Arrow. Every High-Probability Setup. Free.
The Fusion Indicator combines multiple signals into a single buy/sell arrow on TradingView so you never miss a move.

From Find Better Trades
Ride The Trend. Skip The Whipsaw.
Clear directional bias with built-in noise filters and trailing stop logic — from entry to exit.

📈 Want More? Join Our Free Trading Community
- Trading Strategy Guides Telegram — daily strategy tips and market insights
- Find Better Trades Telegram — free trade signals delivered to your phone
- Find Better Trades on YouTube — live trade breakdowns and tutorials


