
RSI + Support: The Only Combo You Need to Spot a Real Bounce

📊 August 9, 2026
- RSI oversold readings are complete noise unless price is touching key horizontal support.
- Buying an indicator drop below 30 during a heavy trend selloff will catch a falling knife every single time.
- Wait for price to hit a multi-touch demand zone and form bullish RSI divergence before taking a trade.
— Ben, Find Better Trades
Retail traders love buying stocks just because the Relative Strength Index drops below 30. That single lazy habit has blown up more trading accounts than almost any other technical mistake I see. If you want to catch explosive moves when markets open tomorrow, you must pair momentum with actual market structure.
Why Everyone Gets This Wrong
Most traders treat the traditional 30 reading on RSI like a magical floor where prices automatically bounce. They see the oscillator dip into oversold territory, hit market buy, and watch in horror as price continues to cascade downward while RSI stays pinned at the bottom for days.
Indicators measure momentum velocity, not price floor levels. In a heavy institutional liquidation, RSI can stay oversold indefinitely while an asset loses another twenty percent of its value. Buying purely because an oscillator says oversold is standing in front of a freight train with a paper net.
Picture an asset breaking down below a long-term range on heavy volume. It triggers an oversold RSI reading at $100, but the actual structural floor sitting on the daily chart is down at $85. Entering at $100 simply because an indicator reads 25 burns capital while institutional buyers wait patient for $85.
What Actually Works
The fix is simple: use RSI strictly as a timing trigger at key levels, never as a standalone reason to enter. First, chart explicit horizontal support zones where buyers previously stepped in aggressively and pushed price higher.
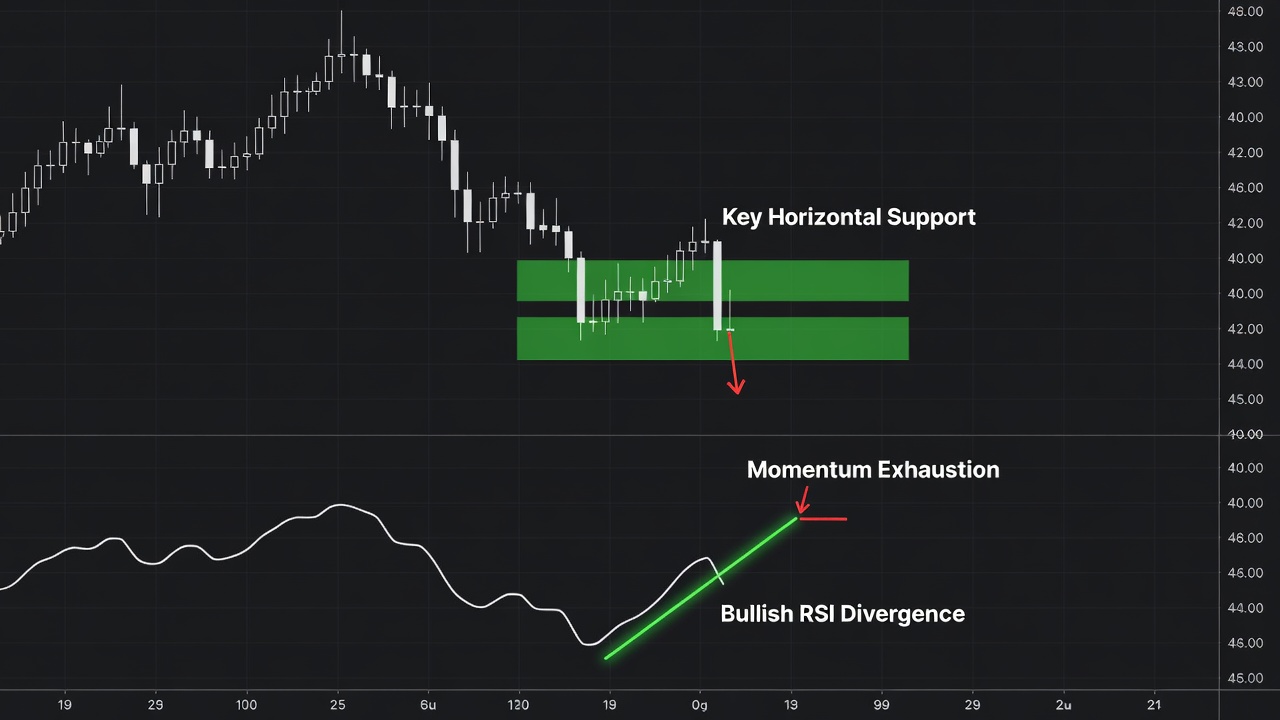
Heading into Monday, your job is to wait until price enters that support zone and shows bullish RSI divergence. This occurs when price makes a lower low into your support level while the RSI oscillator forms a higher low, signaling that downside momentum is exhausted right at structural demand.
Instead of guessing, wait for a strong confirmation candle to close on your execution chart inside that support level alongside the divergence. Place your stop-loss just under the structural level to keep risk tight while riding the high-probability bounce back to supply.
When RSI Can Still Help
RSI is not a broken tool; it is just wildly misused by retail traders looking for easy shortcuts. It performs brilliantly when measuring deceleration at major historical price inflections rather than picking arbitrary bottoms in middle-of-nowhere territory.
When you force RSI to play second fiddle to horizontal support and demand zones, false signals drop sharply. It forces you to wait patiently for high-conviction trades where risk is clearly defined.
🎯 Want Setups Like These? The Big Dipper Does the Scanning For You.
Every morning the Big Dipper delivers curated DIP ZONE trade ideas — stocks already at high-probability entry levels, with targets pre-set. No guessing, no scanning. Just setups.


RSI and Support Trading FAQ
Q: Should I trade RSI divergence on lower timeframes like the 5-minute chart?
A: Intraday noise renders lower timeframe RSI divergence unreliable. Focus on the 1-hour and 4-hour charts where structural support carries institutional weight when markets open tomorrow.
Q: Is it better to buy as soon as RSI touches 30 or wait for it to cross back above?
A: Crossing back above 30 offers slightly better confirmation, but neither matters unless price is sitting directly inside a verified horizontal support zone.
Free For Traders
Know What To Trade BEFORE The Opening Bell
The Big Dipper Dashboard hands you curated high-probability setups every single morning — free.

From Find Better Trades
Know Exactly Where The Big Money Steps In
Auto-plots institutional support & resistance zones from pure price action — no more guessing at levels.

📈 Want More? Join Our Free Trading Community
- Trading Strategy Guides Telegram — daily strategy tips and market insights
- Find Better Trades Telegram — free trade signals delivered to your phone
- Find Better Trades on YouTube — live trade breakdowns and tutorials


