Highs and Lows Lie: Why the Open and Close Rule the Market

📊 August 2, 2026
- The open and close represent true institutional consensus, while extreme highs and lows are mostly retail panic and stop sweeps.
- Chasing wick extremes distorts your risk-to-reward ratio and exposes your positions to deliberate market maker liquidity grabs.
- Anchor your primary support and resistance zones to candlestick bodies heading into Monday’s open to instantly filter out market noise.
— Ben, Find Better Trades
If you are still drawing your key support and resistance lines across absolute high and low wicks, you are voluntarily feeding your capital to market makers. Extreme wicks do not represent fair value or real trend strength; they represent brief moments of low liquidity, panic, and engineered stop raids.
I stopped anchoring my trading levels to extreme high and low wicks years ago, and my execution quality improved instantly. When markets open tomorrow, start ignoring the outer noise and focus on where real capital enters and settles: the open and the close.
Why Everyone Gets This Wrong
Standard trading textbooks tell you to find a chart, locate the highest peak and the lowest trough, and slap a horizontal line across the tips of the wicks. It sounds logical on paper, but when you execute that strategy in live market conditions, it breaks down quickly.
An extreme high or low frequently occurs on paper-thin volume during a sudden volatility spike or opening bell sweep. Think about a sudden news headline or an algorithmic sweep that pushes price four points past a level for twenty seconds before immediately snapping back. That wick point is not a structural level of institutional interest; it is an operational inefficiency.
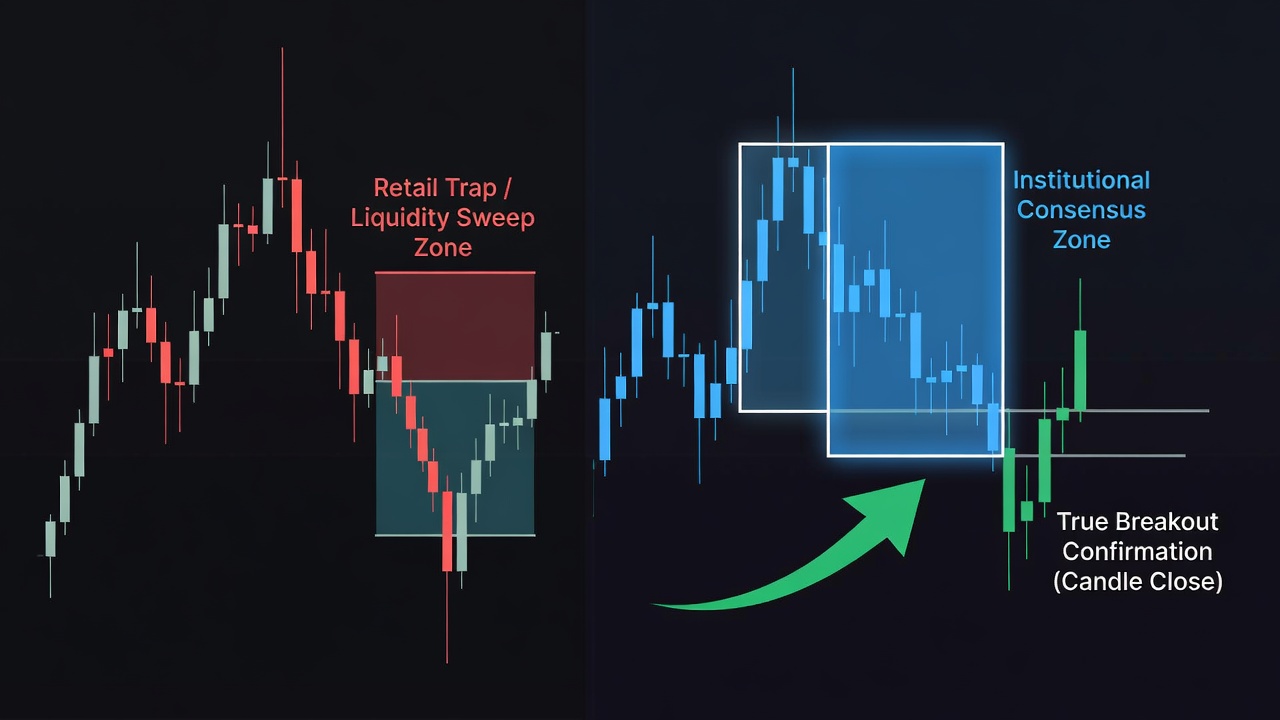
When you place your breakout entries or stop losses directly against those wick tips, you are trading against ghost levels. Institutional algorithms know retail orders pool around those obvious high and low wicks, and they use those exact points to run liquidity before driving price in the actual direction of the trend.
By treating a one-minute price spike with the same importance as a multi-hour consolidation body, you severely distort your risk profile. You end up taking wide, sloppy entries and getting chopped up right where smart money is offloading positions into retail chase.
What Actually Works
Real institutional commitment is revealed in two places: where price opens and where it closes. The opening price sets the baseline auction valuation for a trading session, while the closing price shows who held control after all opposing liquidity was fully absorbed.
Instead of drawing support and resistance across outer wicks, draw your primary zones across candlestick bodies—the boundary between the open and the close. When a candle closes cleanly past a body zone, that signal represents structural acceptance and true order flow progression, not just a temporary spike.
Heading into Monday’s open, review your key charts and adjust your key levels to reflect candle bodies on higher timeframes. If price spikes through a level intraday but the candle body closes back inside the previous range, treat it as a clear rejection rather than a genuine breakout.
This simple technical shift eliminates a massive amount of market chatter. You will stop falling for intraday traps because you are requiring candle closures to confirm whether big money actually intends to hold price at those higher or lower levels.
When Highs and Lows Still Matter
I am not telling you that extreme wicks are completely useless, but their job on your chart is heavily misunderstood. Highs and lows should not define your primary value zones, but they excel at identifying liquidity targets and measuring tail risk.
An extreme wick shows you exactly where stops were swept and where aggressive aggressive market orders ran out of steam. Use those outer wick tips as target zones for taking profits or as logical invalidation points for your stop losses, but keep your primary entry structure anchored to candle bodies.
🎯 Want Setups Like These? The Big Dipper Does the Scanning For You.
Every morning the Big Dipper delivers curated DIP ZONE trade ideas — stocks already at high-probability entry levels, with targets pre-set. No guessing, no scanning. Just setups.


Frequently Asked Questions About Open and Close Trading
Q: Should I completely ignore candle wicks when drawing my support and resistance lines?
A: No, but you should treat candle wicks as liquidity zones rather than structural boundaries, using candlestick bodies for primary support and resistance levels.
Q: Which timeframe closing price carries the most weight for determining real trend direction?
A: Daily and weekly closing prices carry the most weight because they reflect institutional position building and broad market consensus rather than intraday noise.
Free For Traders
One Clear Arrow. Every High-Probability Setup. Free.
The Fusion Indicator combines multiple signals into a single buy/sell arrow on TradingView so you never miss a move.

From Find Better Trades
Stop Scanning Charts. Let The Alerts Come To You.
Real-time Telegram alerts when stocks approach critical S&R levels across the whole market.

📈 Want More? Join Our Free Trading Community
- Trading Strategy Guides Telegram — daily strategy tips and market insights
- Find Better Trades Telegram — free trade signals delivered to your phone
- Find Better Trades on YouTube — live trade breakdowns and tutorials