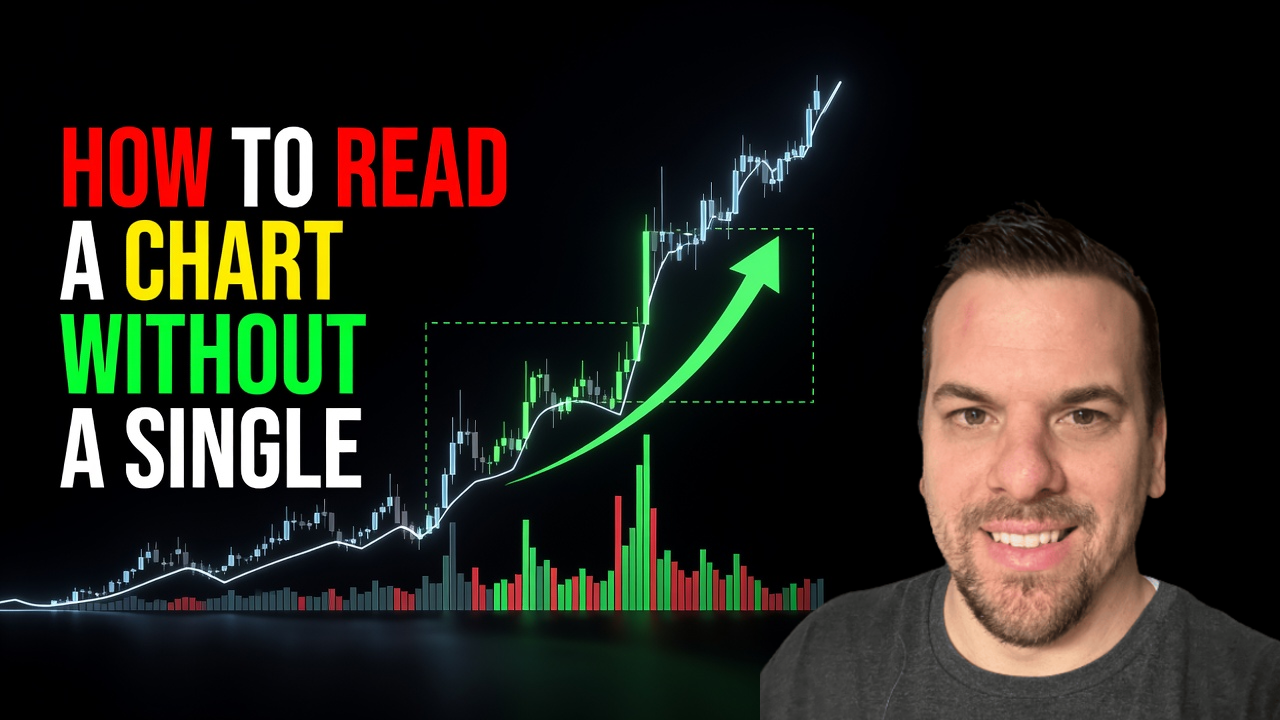
How to Read a Chart Without a Single Indicator (And Win)

📊 August 1, 2026
- Naked price action reveals raw order flow right now, while standard indicators only report past math calculations.
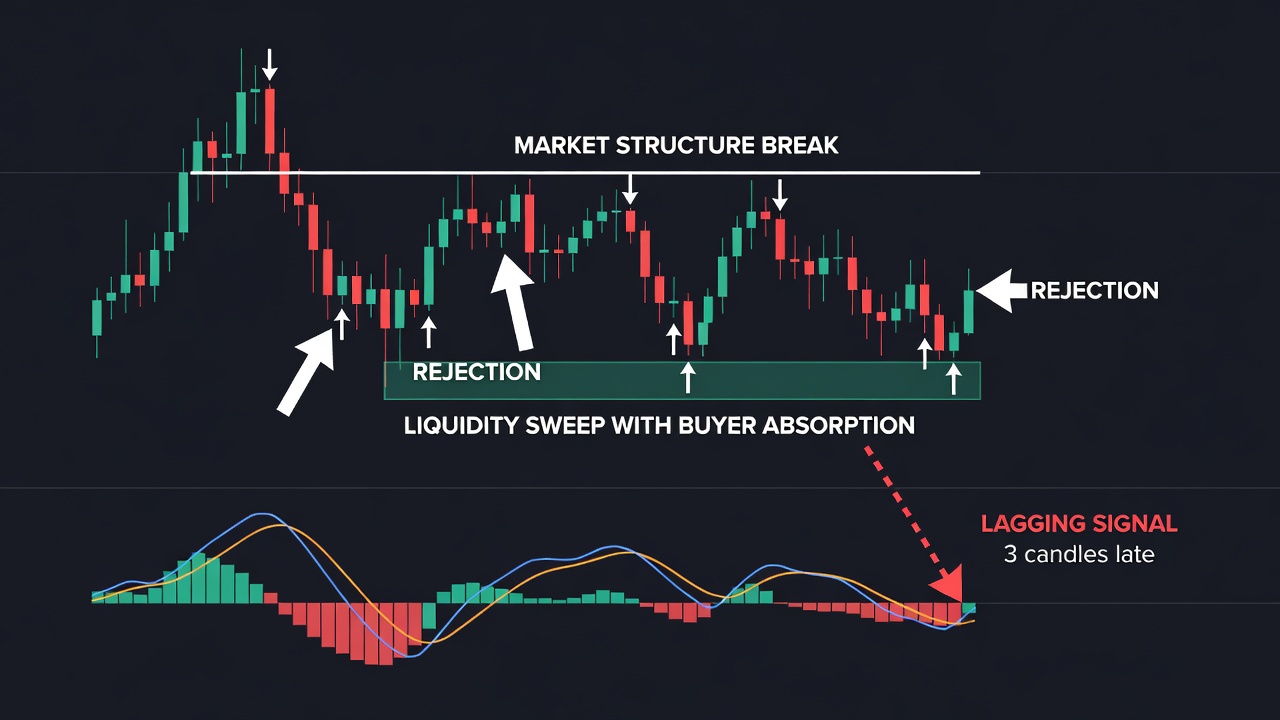
- The biggest mistake retail traders make is waiting for lagging indicator crossovers, which forces entries right at the tail end of moves.
- Focus on high-timeframe market structure, candle closing velocity, and key liquidity sweeps when markets open Monday.
— Ben, Find Better Trades
If your trading chart looks like a Jackson Pollock painting covered in moving averages, MACD histograms, and stochastic bands, you are fighting an uphill battle. Every traditional indicator is merely a derivative calculation of price and time, which means it will always lag behind the live market movement. Heading into next week, strip every single overlay off your screen so you can finally see pure order flow unfolding in real time.
Why Everyone Gets This Wrong
Most retail traders treat indicators like magic permission slips to execute orders. When a moving average crosses or an oscillator enters an extreme zone, they assume a trade setup has magically appeared. What they fail to realize is that by the time your favorite oscillator prints an overbought or oversold signal, institutional traders have already completed their position building and are looking for exit liquidity.
Picture a stock consolidating in a tight three-day range right beneath major resistance. A traditional trader waits for a triple moving average alignment and a MACD bullish cross before entering long. By the time all three of those lagging indicators align, price has already surged four percent straight into institutional supply, leaving the retail trader buying the absolute top of the move.
Indicators completely obscure raw price velocity and candle dynamics. A trailing indicator cannot distinguish between a violent liquidity trap and a legitimate institutional breakout. It simply smooths out historical data points, lulling you into taking delayed entries with wide stop losses right before the market reverses against you.
When you rely on indicator signals, you end up reacting to the indicator rather than reading the asset itself. You become blind to aggressive wick rejections, shrinking candle bodies, and clear structural shifts. That delay is precisely why so many retail traders consistently enter right when smart money is closing out their positions.
What Actually Works
Reading a naked chart boils down to three core components: market structure, candle velocity, and liquidity pools. When markets open Monday, your first job is to mark the obvious swing highs and swing lows on the daily and four-hour charts. Market structure tells you who is in control: consecutive higher highs and higher lows define an uptrend, while lower highs and lower lows confirm seller dominance.
Next, focus on how price behaves as it approaches those structural levels by watching candle body closes. Large full-bodied candles closing near their extreme high or low demonstrate real institutional aggression. Conversely, small narrow-range candles with long upper wicks at a resistance level signal that buyers are exhausting themselves and limit orders are taking control.
Finally, identify obvious pools of liquidity where retail stop losses are sitting. Equal highs and equal lows act like magnetic targets because market makers need that concentrated volume to fill large institutional orders. When price aggressively sweeps past a major swing high only to immediately snap back and close below it, you have identified a classic liquidity run without needing a single indicator line.
By putting these three elements together, your execution becomes proactive instead of reactive. You enter trades at precise structural pivot points with tight, logical stops rather than chasing late momentum signals. You trade what price is doing right now, not what a lagging mathematical formula thinks happened ten bars ago.
When Technical Indicators Can Still Help
I am not arguing that every technical indicator should be banned from your charting platform forever. A single reference line like a 200-period moving average can serve as a quick macro trend filter when scanning hundreds of charts. It instantly tells you whether you are trading with or against the broad multi-month bias.
Similarly, volume tools like Anchored VWAP or daily volume profiles provide objective data regarding where high-volume price agreements occurred. Use them strictly as visual reference points to locate key price levels, never as execution triggers to buy or sell. Price action remains the king, while indicators should only ever play a supporting background role.
🎯 Want Setups Like These? The Big Dipper Does the Scanning For You.
Every morning the Big Dipper delivers curated DIP ZONE trade ideas — stocks already at high-probability entry levels, with targets pre-set. No guessing, no scanning. Just setups.


Frequently Asked Questions About Naked Chart Reading
Q: Can trading without indicators really improve execution performance?
A: Yes, because removing lagging overlays forces you to react directly to live price action and market structure. This eliminates delayed entries, reduces clutter, and allows you to set tighter, structure-based stop losses.
Q: How long does it take to learn how to read raw price charts accurately?
A: Most traders begin identifying clean structural shifts and liquidity sweeps within two to three weeks of deliberate practice. Strip your charts completely naked when markets open Monday, and track daily swing points across twenty consecutive trading sessions.
Free For Traders
Know What To Trade BEFORE The Opening Bell
The Big Dipper Dashboard hands you curated high-probability setups every single morning — free.

From Find Better Trades
Three Signals Align. Your Phone Buzzes. That’s It.
Trisignal only fires when all three confluence conditions line up — high-probability alerts sent straight to Telegram.

📈 Want More? Join Our Free Trading Community
- Trading Strategy Guides Telegram — daily strategy tips and market insights
- Find Better Trades Telegram — free trade signals delivered to your phone
- Find Better Trades on YouTube — live trade breakdowns and tutorials