Price Action vs Indicators: Why Pros Trade Naked Charts

📊 July 30, 2026
- Indicators are lagging mathematical noise that force you into late, low-probability entries.
- The single biggest flaw is treating delayed calculations as predictive signals instead of reading real-time order flow.
- Strip your charts down to raw market structure, key liquidity levels, and immediate candle reactions.
— Ben, Find Better Trades
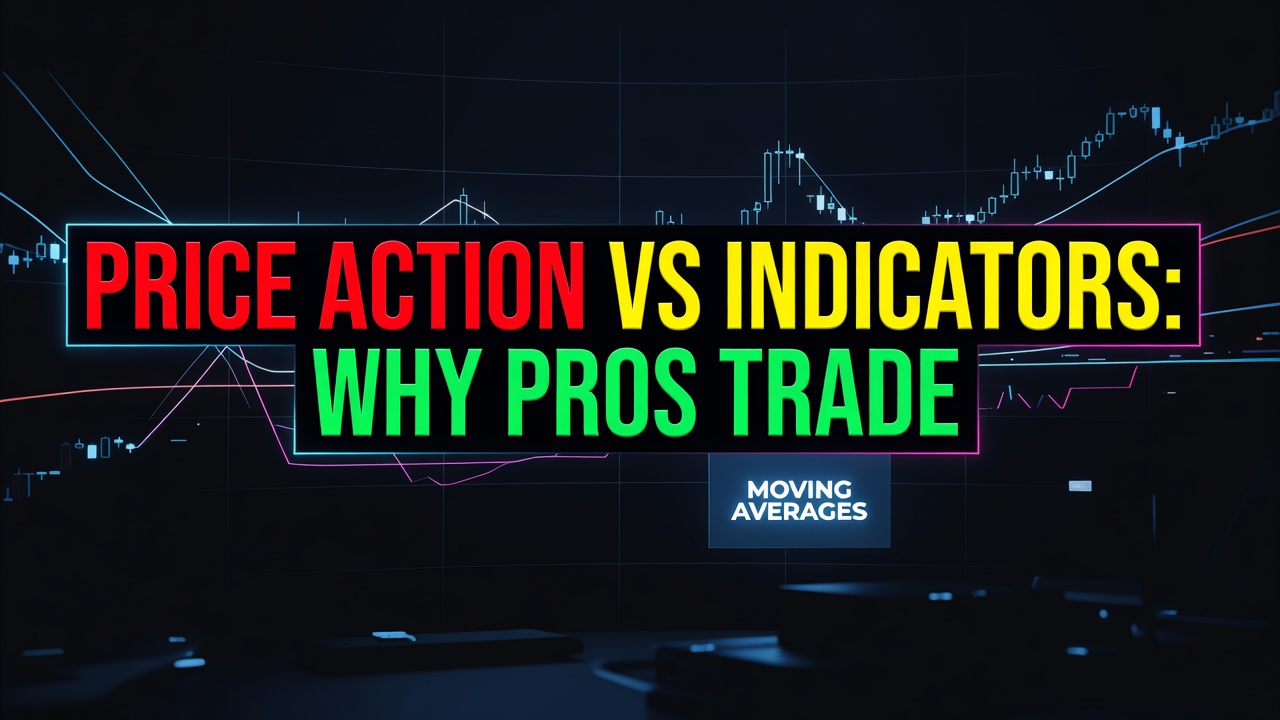
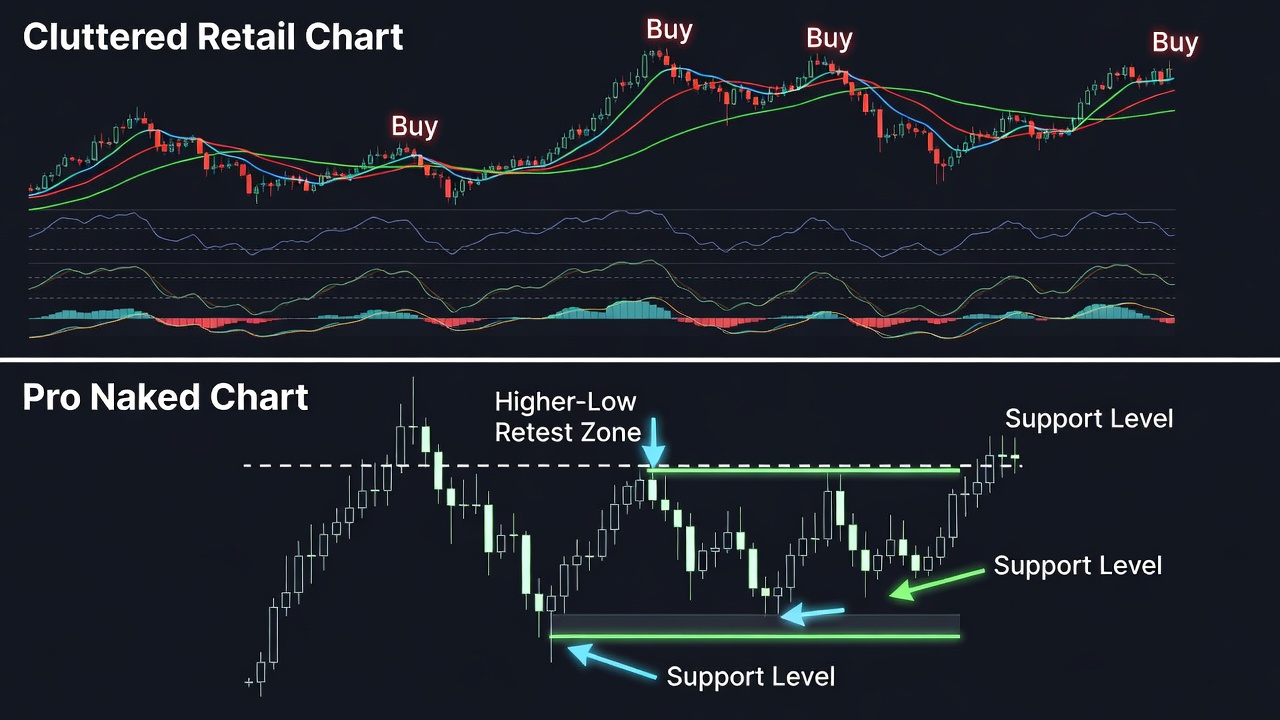
If your trading layout looks like a rainbow spilled across a advanced math textbook, you are actively giving away your edge. Retail traders love stacking MACD, RSI, and multiple moving averages onto a single screen because it feels scientific and safe. The brutal reality is that every indicator on your chart is a delayed mathematical derivative of price, guaranteeing you arrive late to every real move.
Why Everyone Gets This Wrong
Most retail traders treat technical indicators like crystal balls that predict upcoming momentum. They sit waiting for a golden cross on a twenty-period and fifty-period moving average, believing it gives them an early ticket into a fresh trend. By the time that calculation processes historical closing prices and prints a signal, institutional traders have already bought the low, pushed price higher, and are preparing to dump their position into your late buy order.
Consider a scenario where price drives aggressively into a major resistance level on heavy volume. An RSI oscillator on your lower panel climbs past seventy, screaming that the market is overbought and prompting you to take a premature short position. Meanwhile, a lagging MACD line crosses upward two candles later, prompting you to buy the breakout instead. You end up trapped in total hesitation or taking contradictory positions right inside the worst execution window imaginable.
This heavy reliance on lagging squiggly lines destroys your ability to read actual market dynamic. When you wait for an oscillator to give you permission to trade, you are reacting to what buyers and sellers did three bars ago rather than what they are negotiating right now. It transforms proactive risk management into desperate, reactive chasing.
Indicators also create dangerous confirmation bias that wrecks trading accounts. Traders continuously add secondary tools until they find one indicator line that happens to agree with their underlying trade bias. Instead of cutting a loss when market structure breaks, they hold onto losing positions simply because an oscillator has not reached extreme territory yet.
What Actually Works
Trading naked charts is not about guessing blindly; it is about reading raw supply, demand, and structural context without middleman math. When you delete the clutter from your screen, you are left with candlestick bodies, swing points, and volume. This raw price action tells the immediate, honest story of who holds control in the market.
Your primary focus should always center on market structure shifts—specifically how price behaves when testing key historic zones. Look for aggressive rejections, long absorption wicks, and clean higher lows that signal institutional accumulation before a breakout occurs. A simple retest of a broken structure level provides a low-risk entry point with a precise structural stop-loss long before any lagging line updates.
Instead of hunting for indicator crossovers, train your eyes to spot liquidity pools and aggressive price displacement. When price expands rapidly out of a tight consolidation range with large candles, it leaves behind structural inefficiencies that institutions often return to rebalance. Identifying these high-probability zones on a naked chart allows you to set limit orders exactly where institutional capital executes.
To transition to naked charts today, start by deleting every indicator off your main trading screen. Force yourself to mark key horizontal support and resistance zones purely based on higher timeframe swing highs and lows. Once you learn to interpret real-time candle behavior, your execution speed increases dramatically and your risk-reward ratio improves instantly.
When Indicators Can Still Help
To be completely clear, indicators are not entirely useless if you understand their actual boundaries. They can serve as broad macro visual filters on high timeframes to evaluate general trend direction or scan hundreds of assets quickly.
For example, a simple two-hundred-period moving average on a daily chart provides an instant snapshot of macro trend bias before you zoom in to execute on naked price structure. The key is using the indicator strictly to filter your watchlist, never to trigger your actual trade entries.
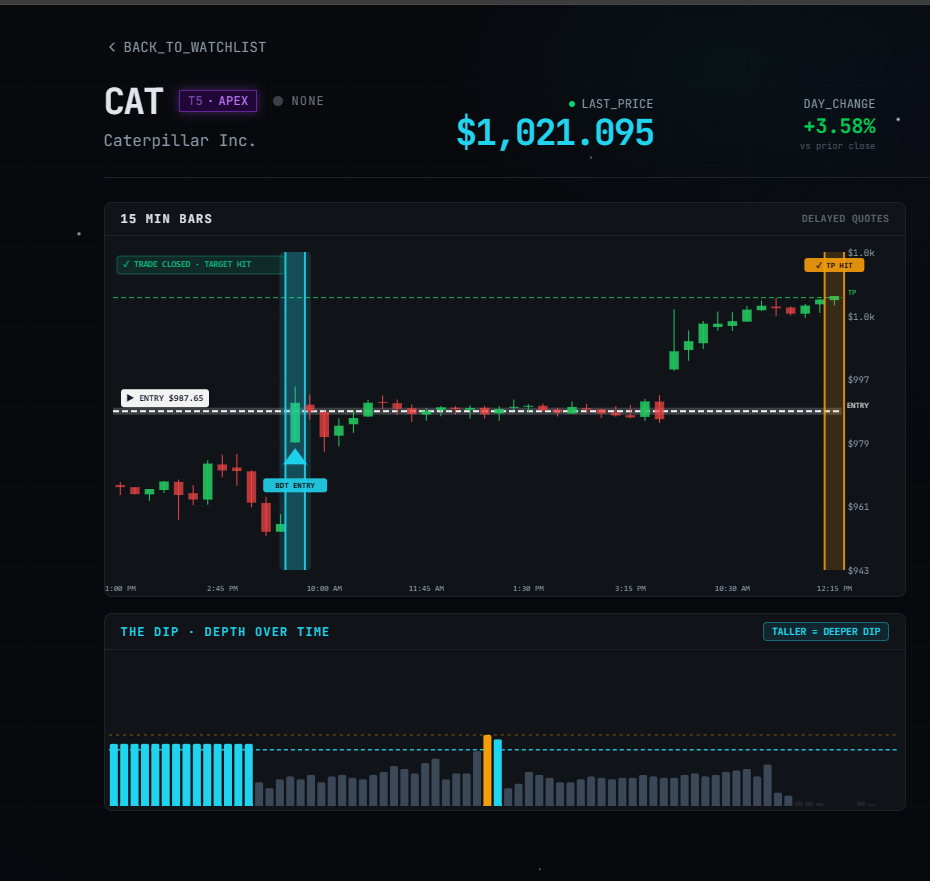
🎯 Want Setups Like These? The Big Dipper Does the Scanning For You.
Every morning the Big Dipper delivers curated DIP ZONE trade ideas — stocks already at high-probability entry levels, with targets pre-set. No guessing, no scanning. Just setups.

Price Action vs Indicators FAQ
Q: Can a beginner trade profitably without using any technical indicators?
A: Yes, in fact beginners often develop profitable skills faster on naked charts because they learn market structure and real risk control rather than blindly chasing lagging signals.
Q: Is price action trading effective across all markets and timeframes?
A: Absolutely, because raw price action reflects universal auction dynamics and human psychology, making it equally powerful on five-minute forex charts and daily stock charts.
Free For Traders
This Free Indicator Finds Overbought & Oversold Levels For You
Add the Red & Green Zone indicator to TradingView at zero cost. It does the level-hunting automatically on any chart.

From Find Better Trades
Catch The Reversal Before It Wrecks Your Gains
Pattern-recognition scanner that spots bearish reversals early — protect your profits or time short entries with confidence.

📈 Want More? Join Our Free Trading Community
- Trading Strategy Guides Telegram — daily strategy tips and market insights
- Find Better Trades Telegram — free trade signals delivered to your phone
- Find Better Trades on YouTube — live trade breakdowns and tutorials